Related News
- 00
0000-00
Smart Port Systems Pricing: How to Compare Lifecycle Costs and ROI by Terminal Scale - 00
0000-00
What Drives Bulk Material Handling Pricing in Large Conveyor System Projects? - 00
0000-00
How Shipping Rate Analytics in Europe Help Importers Predict Costs and Route Risk - 00
0000-00
What Buyers Check When Reviewing Used PVC Coating Line Output and Condition - 00
0000-00
Automated Port Systems Cost Breakdown: CAPEX, Integration, and Maintenance Factors
What global shipping rates reveal about demand shifts
Global shipping rates are more than transport costs. They act as a live market sensor for trade demand, inventory strain, route confidence, and regional supply chain momentum. When global shipping rates rise, the cause may be stronger cargo demand, tighter vessel supply, or port congestion. When they fall, the signal may point to weaker orders, excess capacity, or shorter replenishment cycles. For maritime intelligence platforms such as PS-Nexus, rate behavior helps reveal where terminal activity, equipment utilization, and infrastructure priorities are changing across the wider blue economy.
Why a checklist matters when reading global shipping rates
A single freight index rarely tells the full story. Spot rates, contract rates, bunker costs, canal delays, and vessel deployment can move in different directions at the same time.
A checklist approach reduces false conclusions. It helps connect global shipping rates with container flows, port equipment demand, dredging needs, automation priorities, and the commercial outlook for terminal assets.
This is especially useful in a comprehensive industry context, where maritime trade influences heavy machinery, digital control systems, coastal infrastructure, and long-cycle capital planning.
Core checklist: how to interpret global shipping rates correctly
- Compare spot and contract pricing to see whether demand shifts are sudden, temporary, or already embedded in medium-term trade expectations.
- Track route-specific changes across Asia-Europe, Transpacific, intra-Asia, and bulk corridors instead of relying on one blended global shipping rates headline.
- Separate demand signals from supply constraints by checking vessel availability, blank sailings, alliance scheduling, and newbuilding delivery timing.
- Measure congestion at major gateways because waiting time, berth productivity, and yard density often inflate global shipping rates without true consumption growth.
- Review inventory cycles in retail, manufacturing, and commodities to determine whether rate changes reflect restocking, destocking, or delayed procurement.
- Connect bunker fuel, emissions compliance, and canal surcharges to cost inflation before assuming that higher global shipping rates mean stronger cargo demand.
- Check port infrastructure bottlenecks, including crane productivity, AGV flow, yard layout, and channel depth, for hidden operational pressure.
- Compare container and bulk market behavior because dry bulk, liquid bulk, and liner shipping can reveal different stages of industrial demand.
- Watch policy shifts, sanctions, labor actions, and security disruptions, since geopolitical friction can distort global shipping rates quickly.
- Translate rate signals into asset implications by mapping likely effects on terminal gear utilization, automation investment, and dredging activity.
What global shipping rates reveal in different scenarios
Scenario 1: Rates rise while port congestion worsens
This pattern often signals logistics friction more than clean demand growth. Cargo may be moving, but terminal throughput is being constrained by berth delays, labor limits, shallow channels, or inland bottlenecks.
In this case, global shipping rates support a stronger case for quay crane upgrades, yard automation, dredging programs, and scheduling software that improves vessel turnaround.
Scenario 2: Rates fall even as vessel calls remain stable
Stable calls with softer rates may indicate overcapacity, cautious ordering, or weaker pricing power among carriers. It can also reflect shorter supply chains and improved network reliability.
For port-linked capital planning, this suggests focusing less on emergency expansion and more on productivity gains, maintenance strategy, and selective automation with clear payback.
Scenario 3: Bulk rates diverge from container rates
When dry bulk strengthens while containers weaken, industrial and energy demand may be holding up better than consumer goods demand. Iron ore, coal, grain, and bauxite can point to a different macro cycle.
That divergence matters for heavy terminal gear. Bulk handling machinery demand may remain resilient even when specialized container handling investment slows.
Scenario 4: Rates jump after rerouting or security disruption
A sudden rise in global shipping rates can come from longer transit paths, canal restrictions, insurance surcharges, or regional conflict rather than stronger end-market orders.
This scenario increases interest in resilient port nodes, digital visibility, and flexible terminal planning. It also raises the value of intelligence on route substitution and coastal access capacity.
How PS-Nexus-style maritime intelligence turns rate data into operational insight
Global shipping rates become more useful when paired with engineering and terminal data. That means linking freight movement to crane cycle time, yard transfer velocity, dredger deployment, and control system performance.
For example, a rate surge on a corridor served by draft-limited ports may imply future dredging demand. A sustained export rebound may support investment in remote-controlled cranes, AGV path optimization, or higher-capacity stack systems.
This integrated reading aligns with the PS-Nexus mission: connecting maritime logistics intelligence with terminal machinery, automation architecture, and coastal economics.
Common blind spots when using global shipping rates
- Ignoring rate composition. Headline moves may come from surcharges, fuel adjustments, or emergency routing costs rather than broad demand recovery.
- Treating one index as universal. Global shipping rates vary sharply by lane, cargo type, contract structure, and service reliability.
- Missing inland constraints. Rail disruption, truck shortages, and warehouse saturation can distort maritime price signals.
- Overlooking asset timing. Terminal equipment decisions have long lead times, while freight rates can reverse within weeks.
- Confusing volatility with trend. Short spikes attract attention, but sustained rate direction carries greater value for infrastructure planning.
Practical execution steps
- Build a weekly dashboard combining global shipping rates, vessel schedules, berth waiting time, and port call frequency.
- Add lane-by-lane annotations for disruptions, blank sailings, and fuel changes to explain rate movement before drawing conclusions.
- Cross-check freight data against throughput, crane productivity, and yard occupancy to distinguish demand growth from pure congestion.
- Flag threshold events, such as sustained four-week rate gains, for deeper review of terminal capacity and equipment utilization.
- Use scenario planning for automation, dredging, and heavy gear deployment so capital choices match probable trade direction.
Conclusion and next action
What global shipping rates reveal about demand shifts depends on disciplined interpretation. Rates alone do not define trade health, but they do expose stress, confidence, rerouting, and capacity imbalance faster than many traditional indicators.
The most useful approach is to read global shipping rates beside port mechanics, terminal automation, bulk flow patterns, and coastal infrastructure signals. That is where freight pricing turns into strategic maritime intelligence.
Start with a route-level checklist, verify the operational cause behind each rate move, and then map the signal to equipment, software, or engineering implications. In a changing maritime economy, that discipline creates better decisions and sharper timing.
Related News
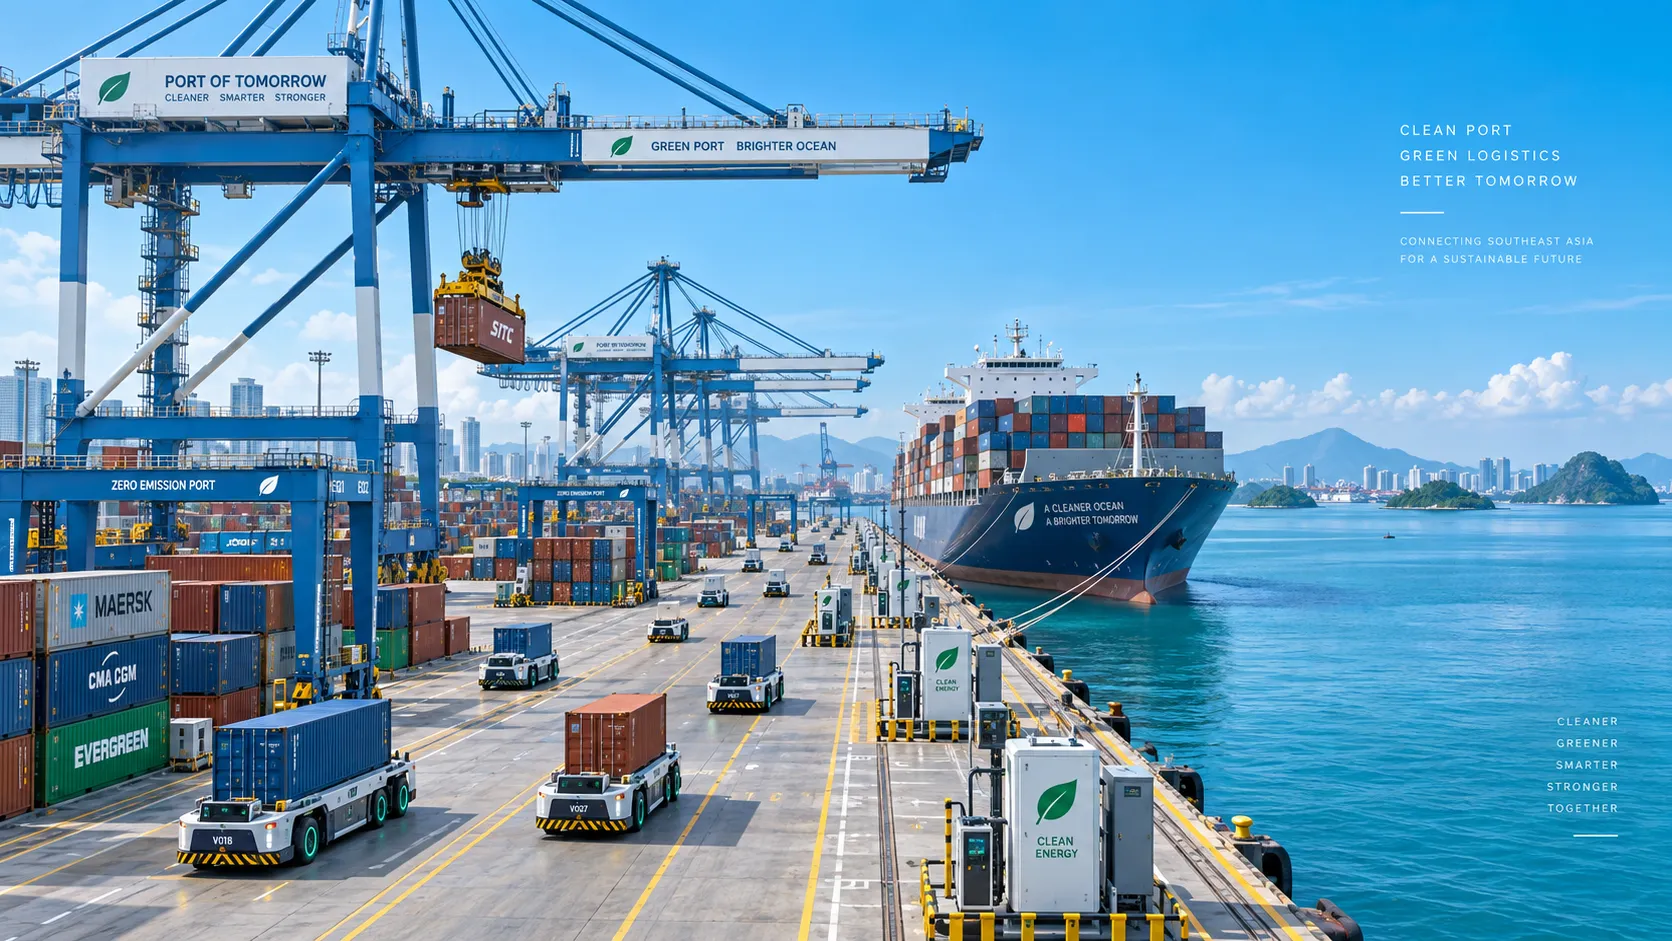
Smart Port Systems in Southeast Asia: Investment Priorities and Adoption Barriers
Smart port systems Southeast Asia: discover investment priorities, adoption barriers, and practical steps to build resilient, connected, high-performing terminals.

How to Evaluate Terminal Efficiency Solution Suppliers for High-Throughput Operations
Choose a terminal efficiency solutions supplier with confidence. Explore proven criteria for throughput, integration, lifecycle cost, safety, and reliable delivery.
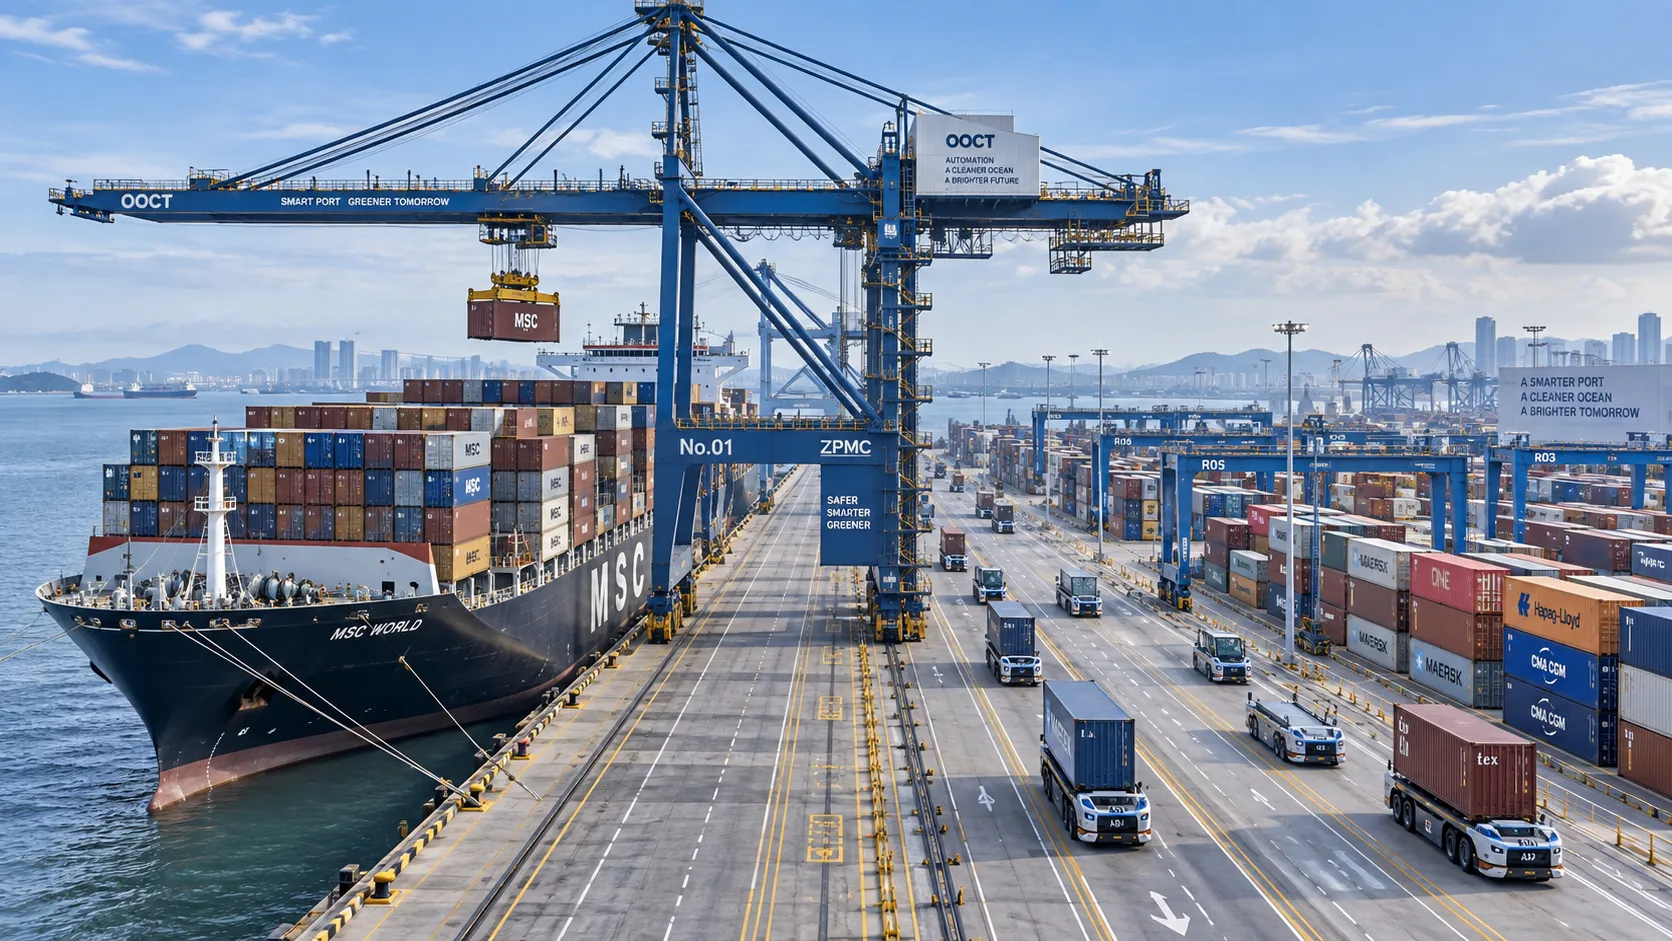
How to Specify a Quay Crane for Container Terminals by Vessel Size and Throughput?
Quay crane for container terminals: learn how to match outreach, lift height, capacity, automation, and cycle performance to vessel size and throughput goals.

What Dredging Equipment Is Needed for Channel Deepening?
What dredging equipment is needed for channel deepening? Explore dredgers, pipelines, survey tools, and planning strategies for safer, more efficient port access.
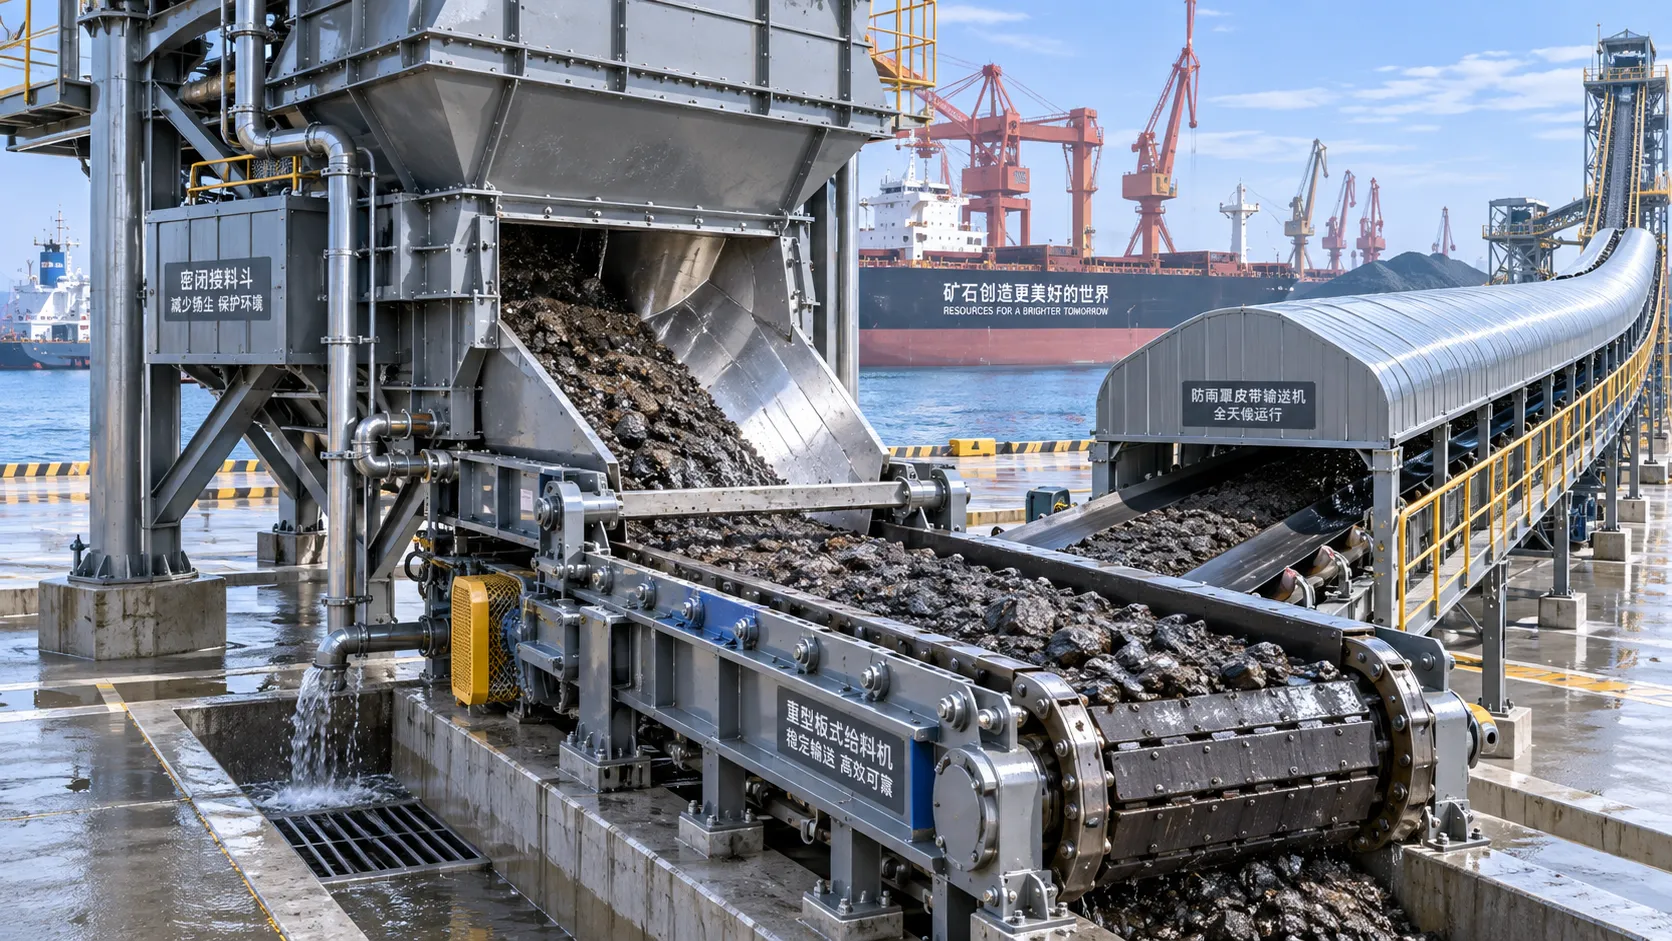
Which Bulk Handling Equipment Suits High-Moisture Cargo?
Which bulk handling equipment suits high-moisture cargo? Compare belt, apron, screw, drag, and slurry systems for reliable flow, less carryback, and higher terminal uptime.
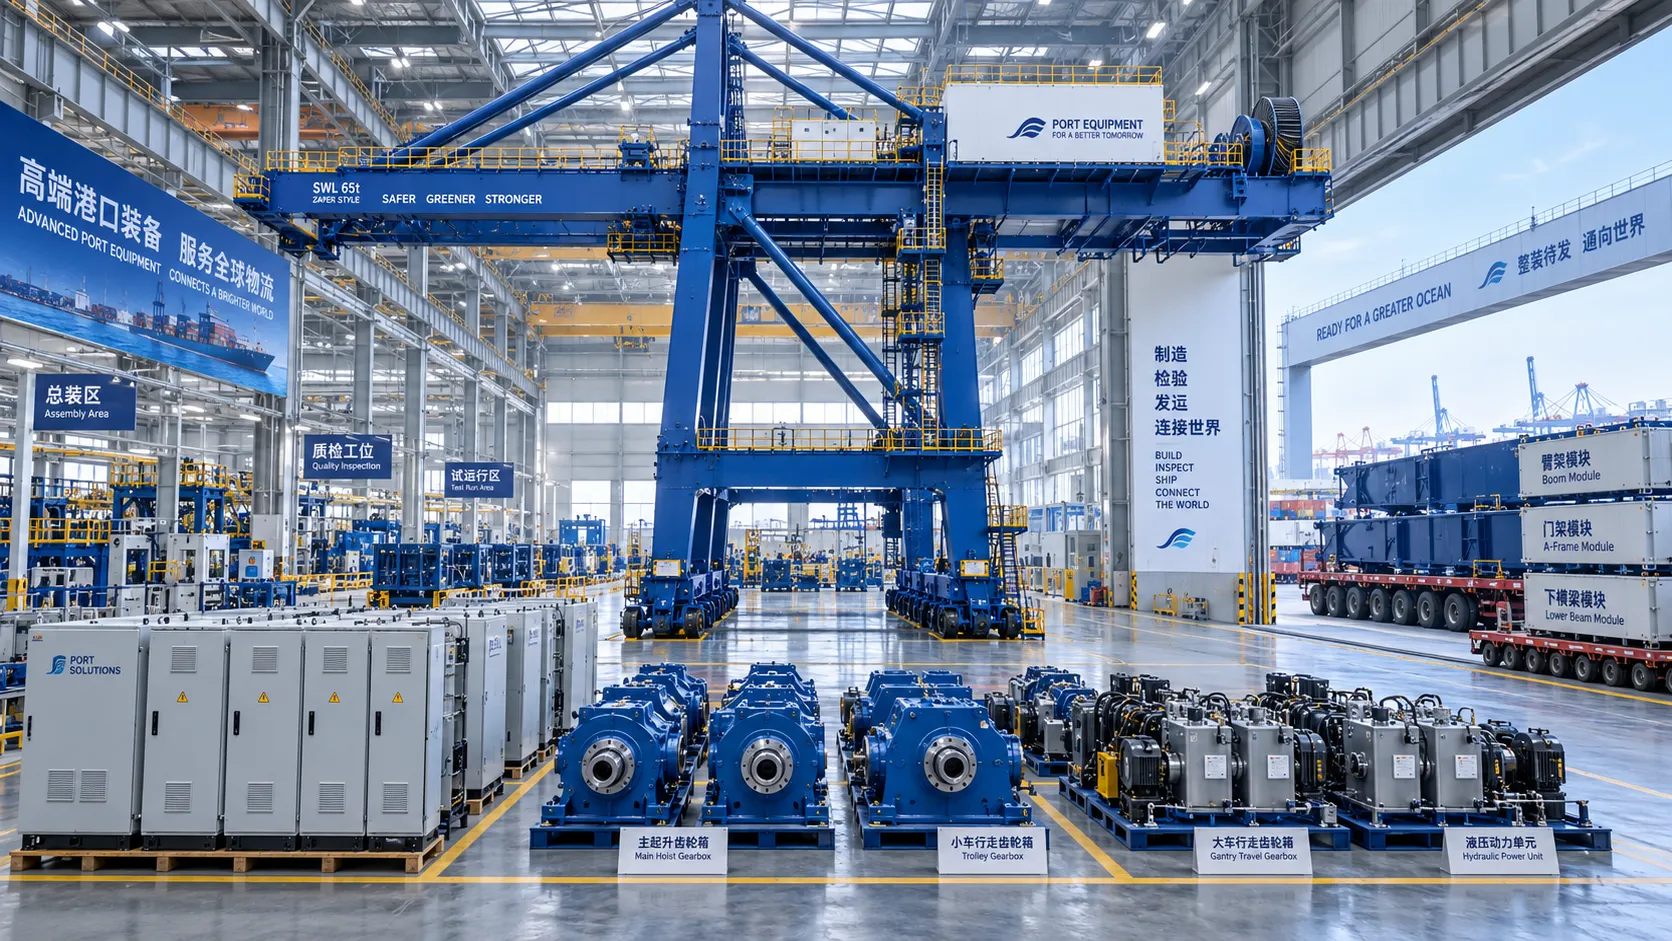
How Can Port Equipment Lead-Time Risk Be Managed?
How can port equipment lead-time risk be managed? Explore practical strategies to control critical paths, suppliers, transport, site readiness, and commissioning delays.
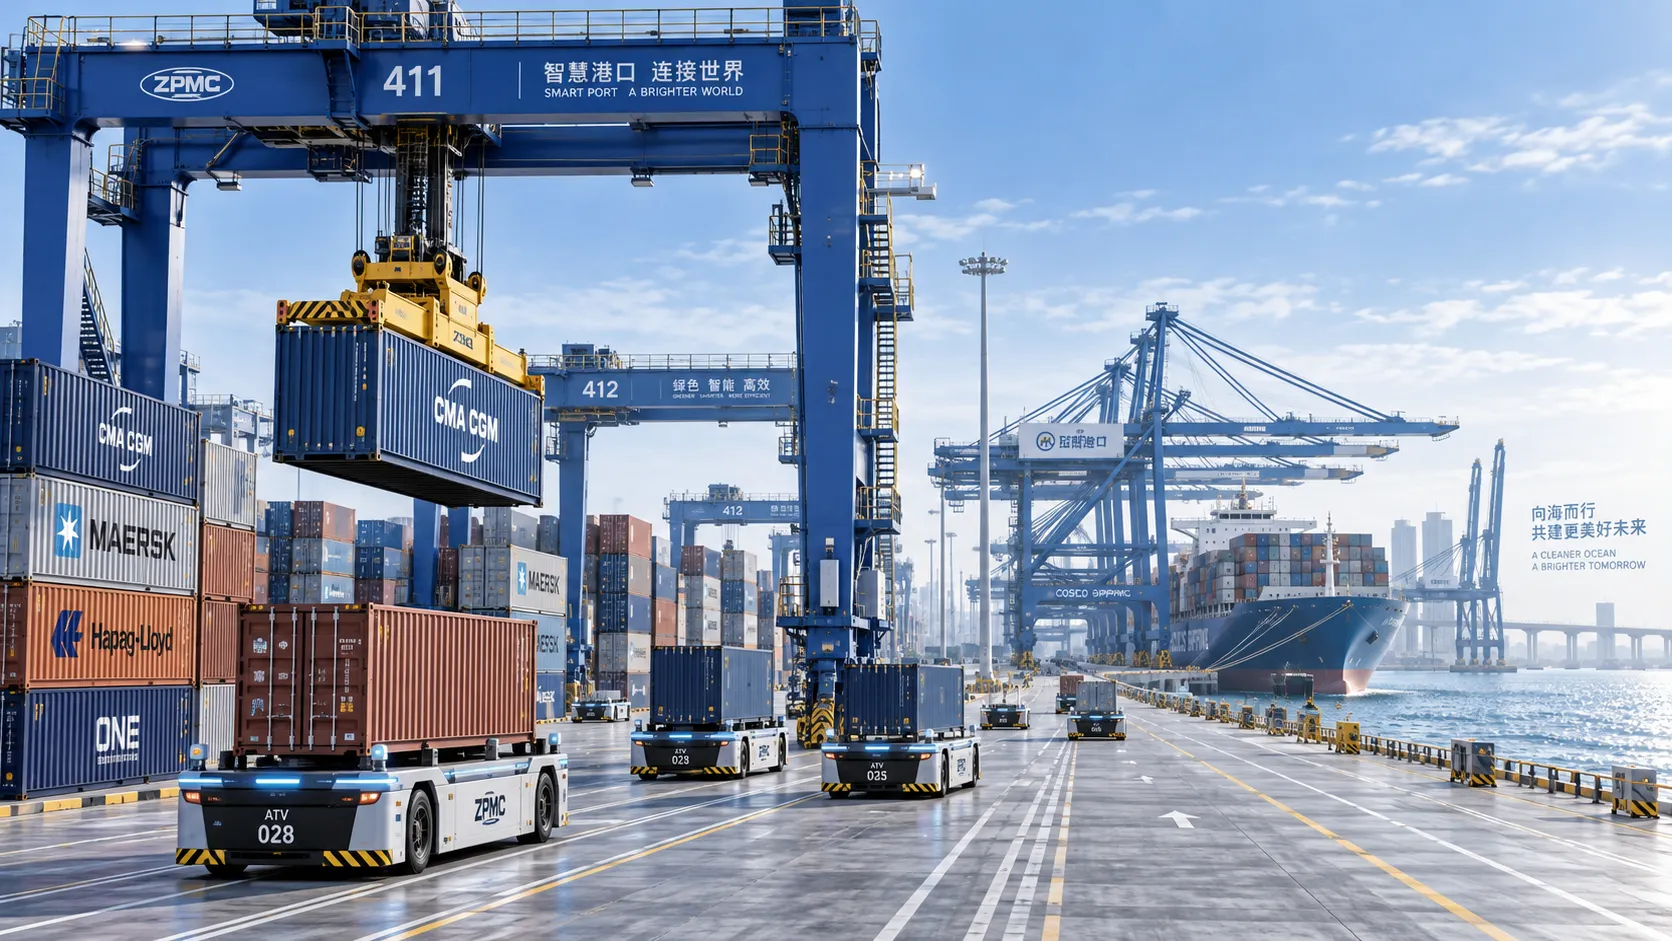
Terminal Automation Technologies That Raise Container Throughput Without Yard Disruption
Terminal automation technology that increases container throughput without disrupting yard flow. Explore smarter integration, resilient workflows, and phased deployment strategies.
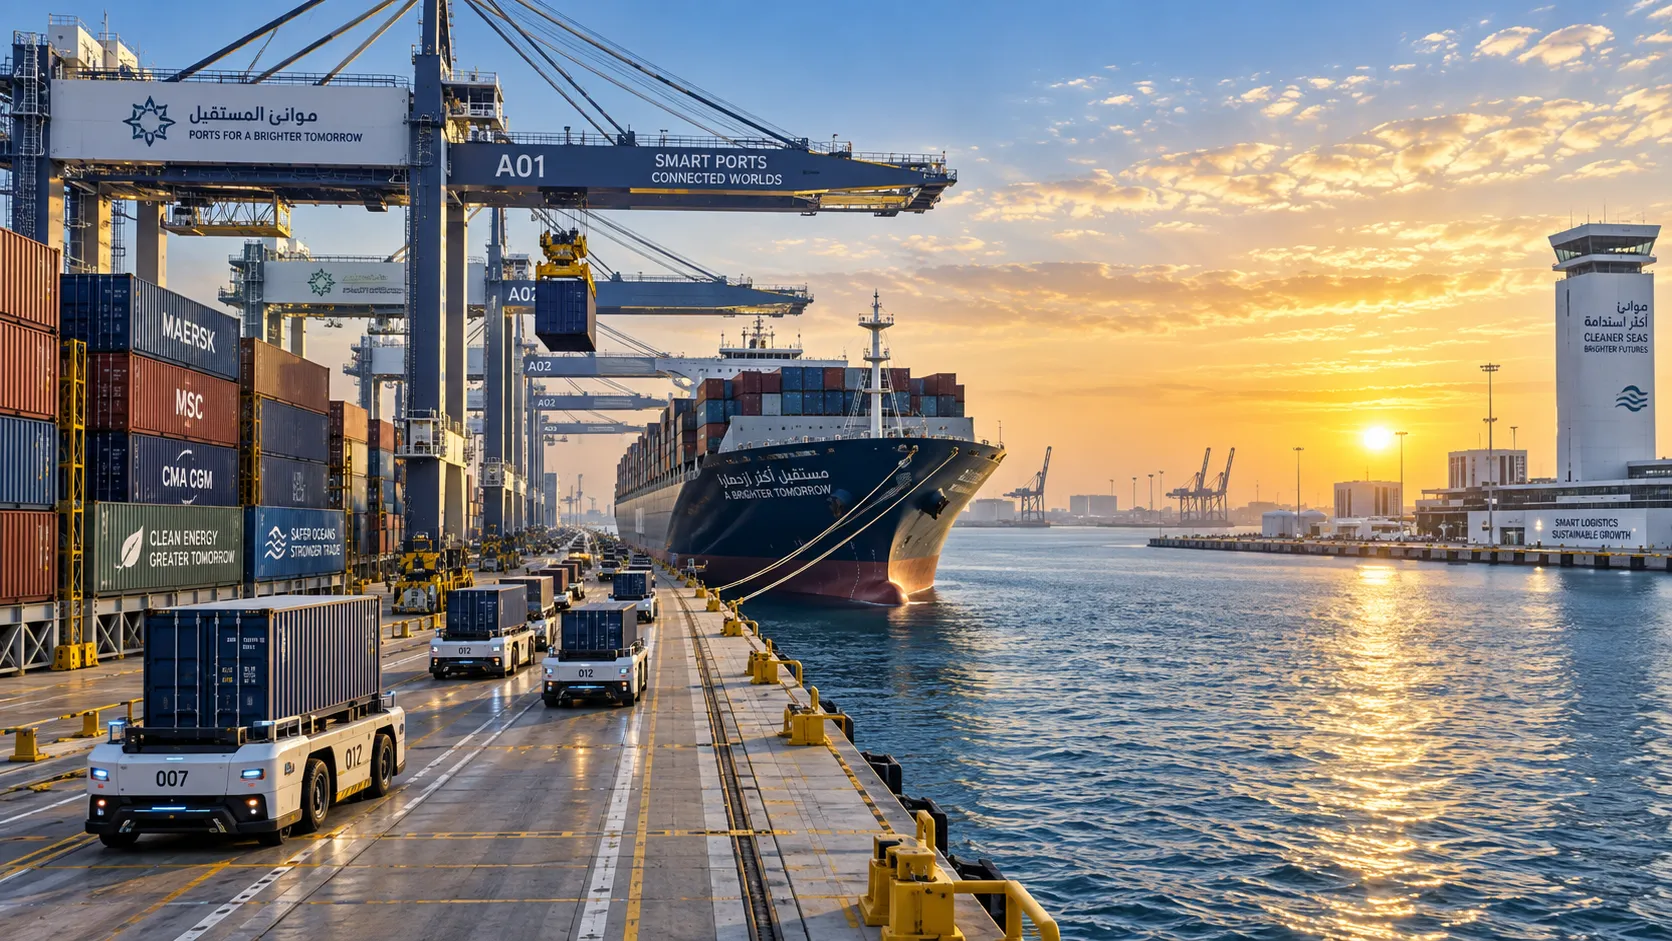
Middle East Port Automation: Key Market Drivers, Projects, and Investment Risks
Port automation systems Middle East: explore market drivers, flagship projects, integration challenges, and investment risks shaping smarter, resilient terminals.
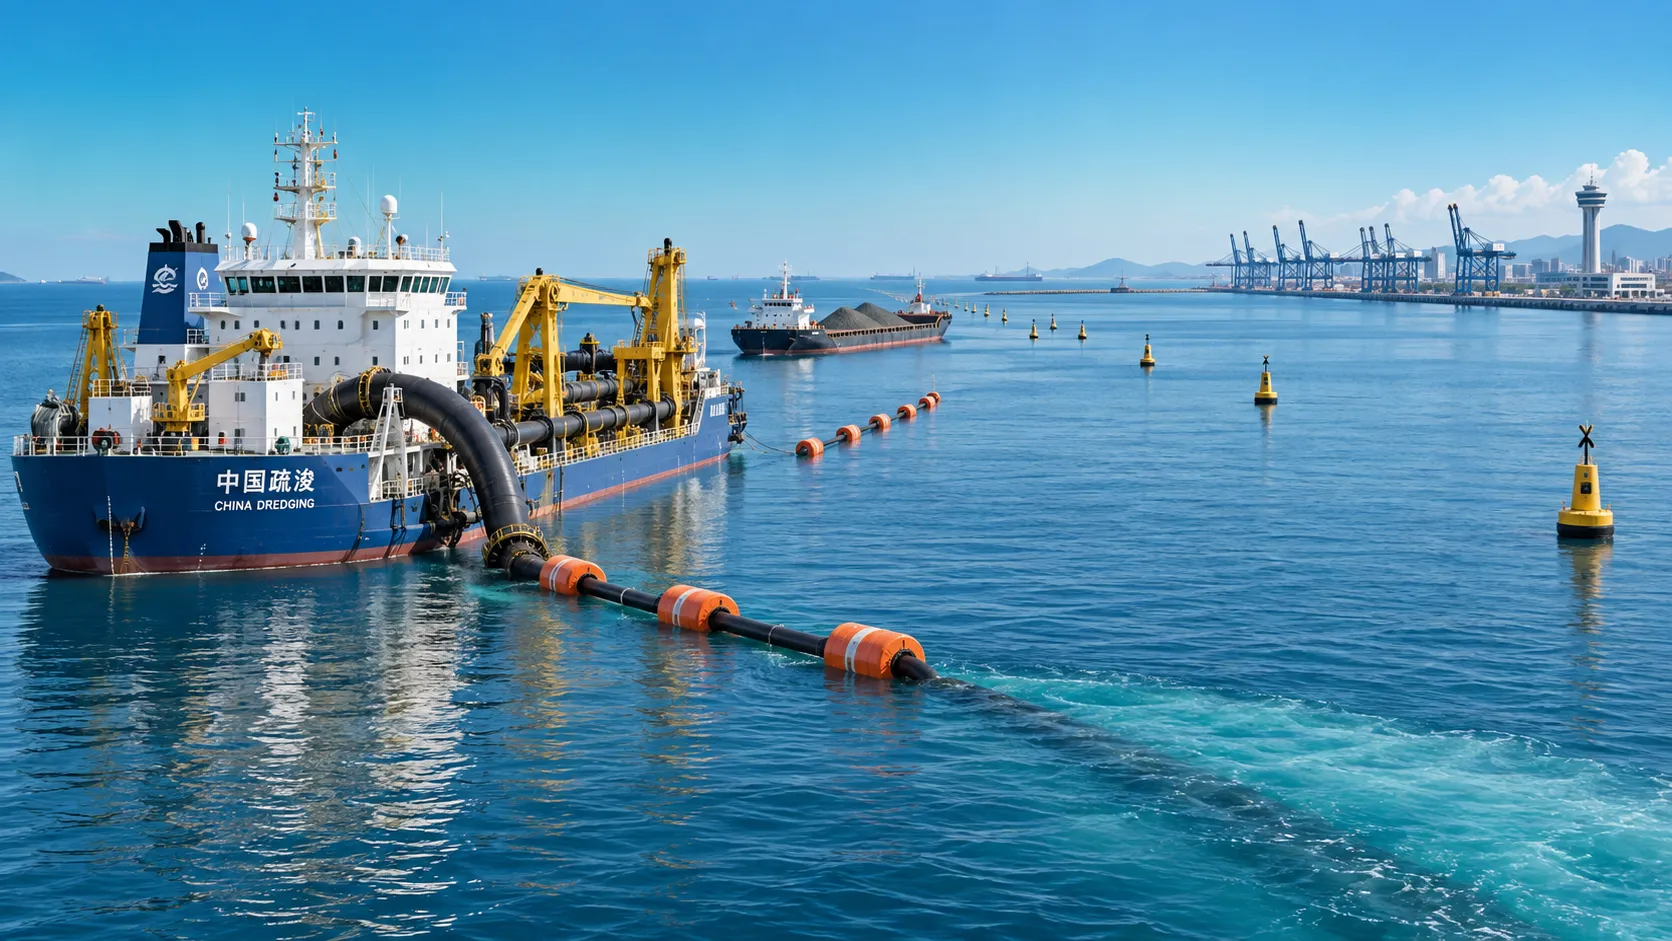
Planning Offshore Dredging Operations: Key Risks, Methods, and Project Controls
Offshore dredging operations demand smart planning. Explore key risks, proven methods, environmental controls, and project strategies for reliable delivery.