Related News
- 00
0000-00
How Can Port Equipment Lead-Time Risk Be Managed? - 00
0000-00
Maritime Logistics Operations: How Ports Can Reduce Container Dwell Time - 00
0000-00
What Does Logistics Node Monitoring Cost Across Warehouses and Transport Hubs? - 00
0000-00
How Can IoT Smart Port Solutions Improve Container Tracking and Yard Efficiency? - 00
0000-00
How Real-Time Port Logistics Intelligence Improves Container Yard Efficiency
Maritime Trade Intelligence in North America: Which Data Signals Matter Most?
North American ports now sit at the intersection of trade volatility, industrial policy, inland logistics pressure, and capital-intensive modernization. That is why maritime trade intelligence North America has moved beyond shipping headlines and into the core of business evaluation.
The useful question is not simply whether cargo is moving. It is which signals reveal capacity strain, equipment readiness, automation maturity, channel access, and regional demand before those shifts become visible in quarterly results.
For firms tracking terminal assets, bulk corridors, container flows, and dredging programs, the strongest insights come from combining infrastructure data with operational behavior. That wider view is where maritime trade intelligence North America becomes commercially meaningful.
What Maritime Trade Intelligence Really Covers
In practice, maritime trade intelligence is a layered reading of how ports, vessels, terminals, equipment, and coastal policy interact. It is not one dashboard, one rate index, or one customs dataset.
A North American view must include container gateways, energy export terminals, grain and mineral corridors, inland rail links, cross-border manufacturing supply chains, and coastal engineering constraints.
This matters because the region does not move as a single market. Gulf Coast bulk activity, West Coast transpacific flows, Great Lakes industrial cargo, and East Coast container growth each produce different signals.
The most reliable maritime trade intelligence North America also connects physical assets to decision logic. Crane availability, yard utilization, AGV routing, berth productivity, and dredging schedules often explain market outcomes better than headline tonnage alone.
Why the Signal Set Has Changed
Older trade monitoring relied heavily on vessel calls, throughput totals, and freight prices. Those indicators still matter, but they now arrive too late for many decisions.
Port congestion can shift within days. Regulatory reviews can delay capacity expansion for months. A dredging gap can limit draft access before official throughput numbers show any problem.
Automation has also changed what should be monitored. A terminal with strong hardware but weak control architecture may show lower resilience than a slightly smaller site with better scheduling logic.
That is one reason intelligence platforms such as PS-Nexus focus on both heavy port equipment and the systems that coordinate it. The commercial value lies in understanding how machines, software, and marine engineering move together.
The Data Signals That Matter Most
1. Port Throughput Quality, Not Just Volume
Raw cargo volume can be misleading. A better measure looks at throughput quality: dwell time, berth turnaround, crane intensity, yard density, and seasonal variance.
A port may report growth while actually losing fluidity. When dwell times rise faster than volume, future congestion risk is often already forming.
2. Terminal Equipment Utilization
Quay cranes, RTGs, reach stackers, conveyor systems, and bulk unloaders define real throughput ceilings. Their uptime, maintenance cycle, and deployment pattern tell more than static equipment counts.
This is especially relevant in maritime trade intelligence North America because labor availability, electrification plans, and retrofit schedules are reshaping asset productivity across the region.
3. Automation and Control Performance
The next decisive signal is not whether a terminal claims to be automated. It is whether automation improves dispatch accuracy, container rehandling rates, gate flow, and exception recovery.
Remote crane communications, path-planning logic for AGVs, and terminal operating system integration increasingly determine whether investments translate into resilient output.
4. Dredging and Navigational Access
Draft depth, channel maintenance, sediment control, and expansion works are often overlooked until access tightens. Yet dredging intelligence can alter vessel class access, insurance assumptions, and route economics.
In coastal trade corridors, marine geotechnical conditions and pump monitoring data can be early signals of future capacity change.
5. Cargo Mix and Structural Demand
Not all tonnage has equal strategic weight. Changes in automotive imports, LNG exports, grain volumes, project cargo, or refrigerated containers can reveal deeper shifts in industrial demand.
For business evaluation, cargo mix often says more about future asset demand than total port volume.
Where These Signals Create Business Value
The practical value of maritime trade intelligence North America lies in comparison. It helps distinguish temporary disruption from structural change.
For example, a short-term surge in vessel queues may be less important than a steady rise in yard automation efficiency. One is noise. The other may point to a stronger terminal franchise.
The same logic applies to port equipment demand. A region expanding channel depth, electrifying handling fleets, and upgrading control systems is signaling more than maintenance spending.
It may be signaling a longer cycle of terminal modernization, specialized container handling demand, and stronger pricing power for high-performance machinery and digital support systems.
This is where PS-Nexus has a useful positioning. Its focus on mega terminal gear, bulk machinery, automated handling, port control systems, and dredging equipment reflects the actual mechanics behind trade capacity.
Reading North America by Corridor and Asset Type
A region-level view is not enough. Good maritime trade intelligence North America breaks the market into operating environments.
- West Coast gateways: watch transpacific container rotation, labor sensitivity, rail handoff speed, and terminal automation intensity.
- Gulf Coast hubs: focus on bulk exports, energy cargo, dredging continuity, and large-scale handling equipment deployment.
- East Coast ports: track capacity expansion, deeper channel access, distribution center pull, and vessel upsizing effects.
- Great Lakes and inland marine links: monitor industrial cargo cycles, seasonal constraints, and multimodal integration.
Asset type also changes the interpretation. A quay crane order suggests one kind of growth signal. A dredging program suggests another. A software-led control upgrade may indicate a different operating strategy altogether.
How to Judge Signal Quality in Practice
Not every dataset deserves equal trust. Some are broad but delayed. Others are precise but too narrow. The goal is to test whether a signal is timely, comparable, and connected to physical outcomes.
Useful evaluation checks
- Check whether the data reflects actual operations or only announced capacity.
- Compare utilization trends with maintenance and upgrade cycles.
- Read automation claims against measurable flow improvements.
- Pair dredging news with draft, vessel class, and access implications.
- Look for repeated movement across several indicators, not isolated spikes.
Usually, the strongest reading comes from signal stacking. Throughput, equipment status, software performance, and infrastructure works should reinforce one another before a major conclusion is made.
A Practical Next Step
A useful starting point is to build a short signal map for the ports, cargo categories, and equipment segments that matter most to current exposure. That keeps maritime trade intelligence North America tied to real commercial questions.
Then narrow the view to five or six repeat indicators: throughput quality, handling asset uptime, automation performance, dredging status, cargo mix, and corridor-specific policy movement.
Over time, that framework makes it easier to identify whether a port is becoming more investable, more constrained, or simply more expensive to operate through.
The market will keep changing, but the discipline remains the same: follow the signals that connect maritime infrastructure, operating logic, and trade demand. That is where clearer judgment usually starts.
Related News
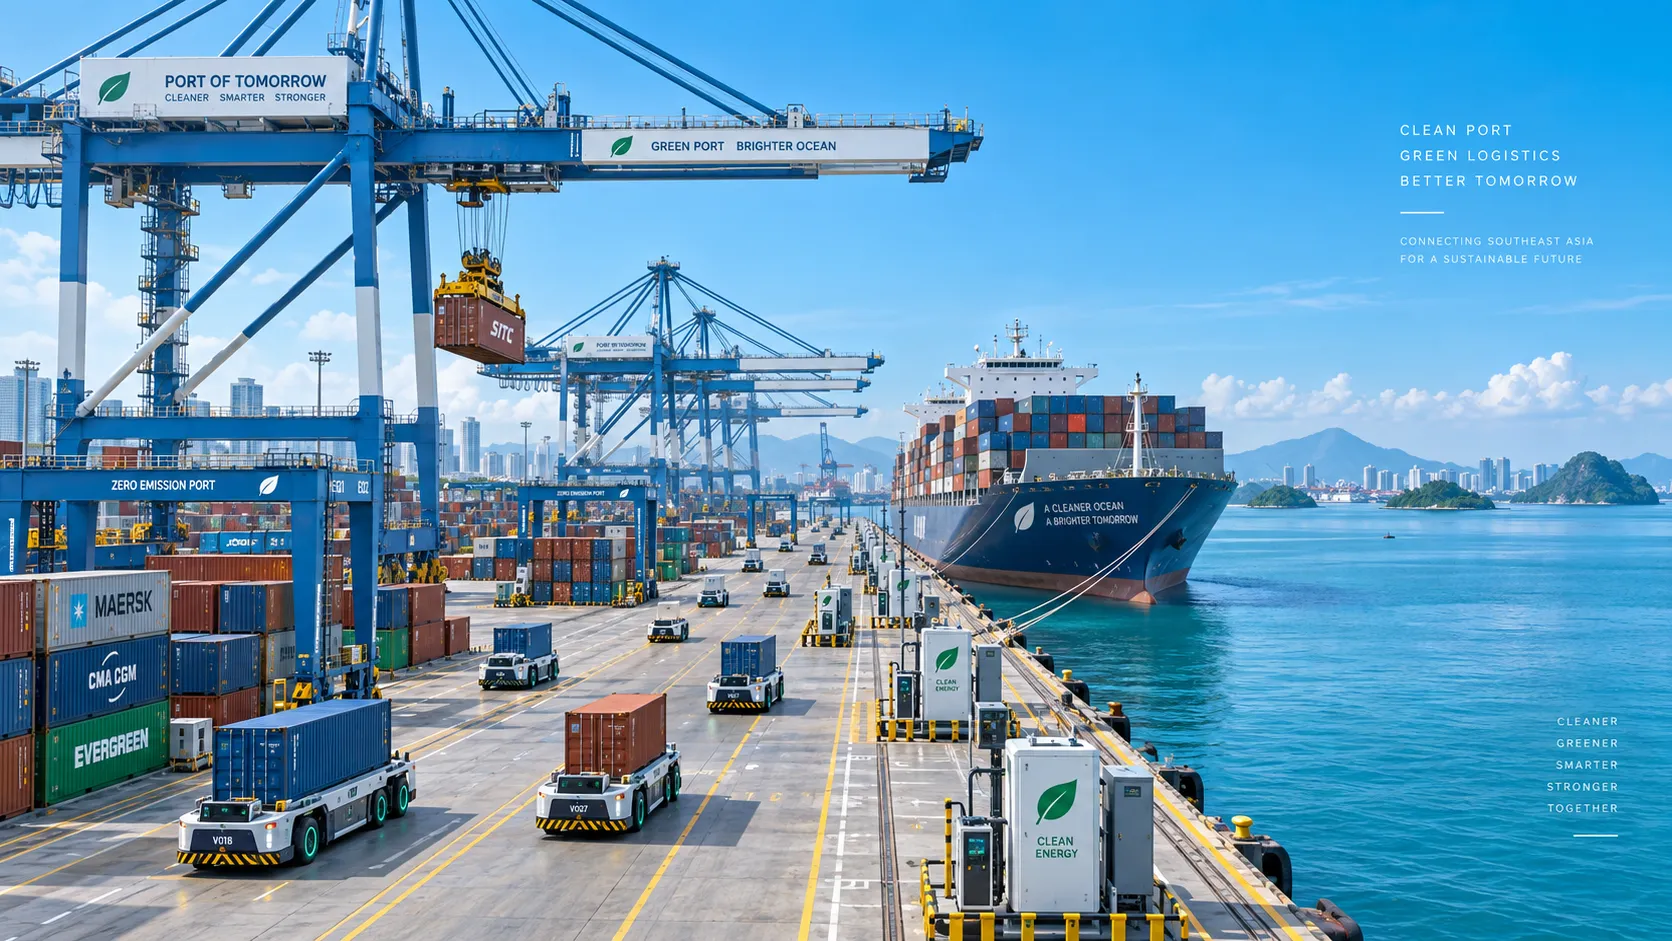
Smart Port Systems in Southeast Asia: Investment Priorities and Adoption Barriers
Smart port systems Southeast Asia: discover investment priorities, adoption barriers, and practical steps to build resilient, connected, high-performing terminals.
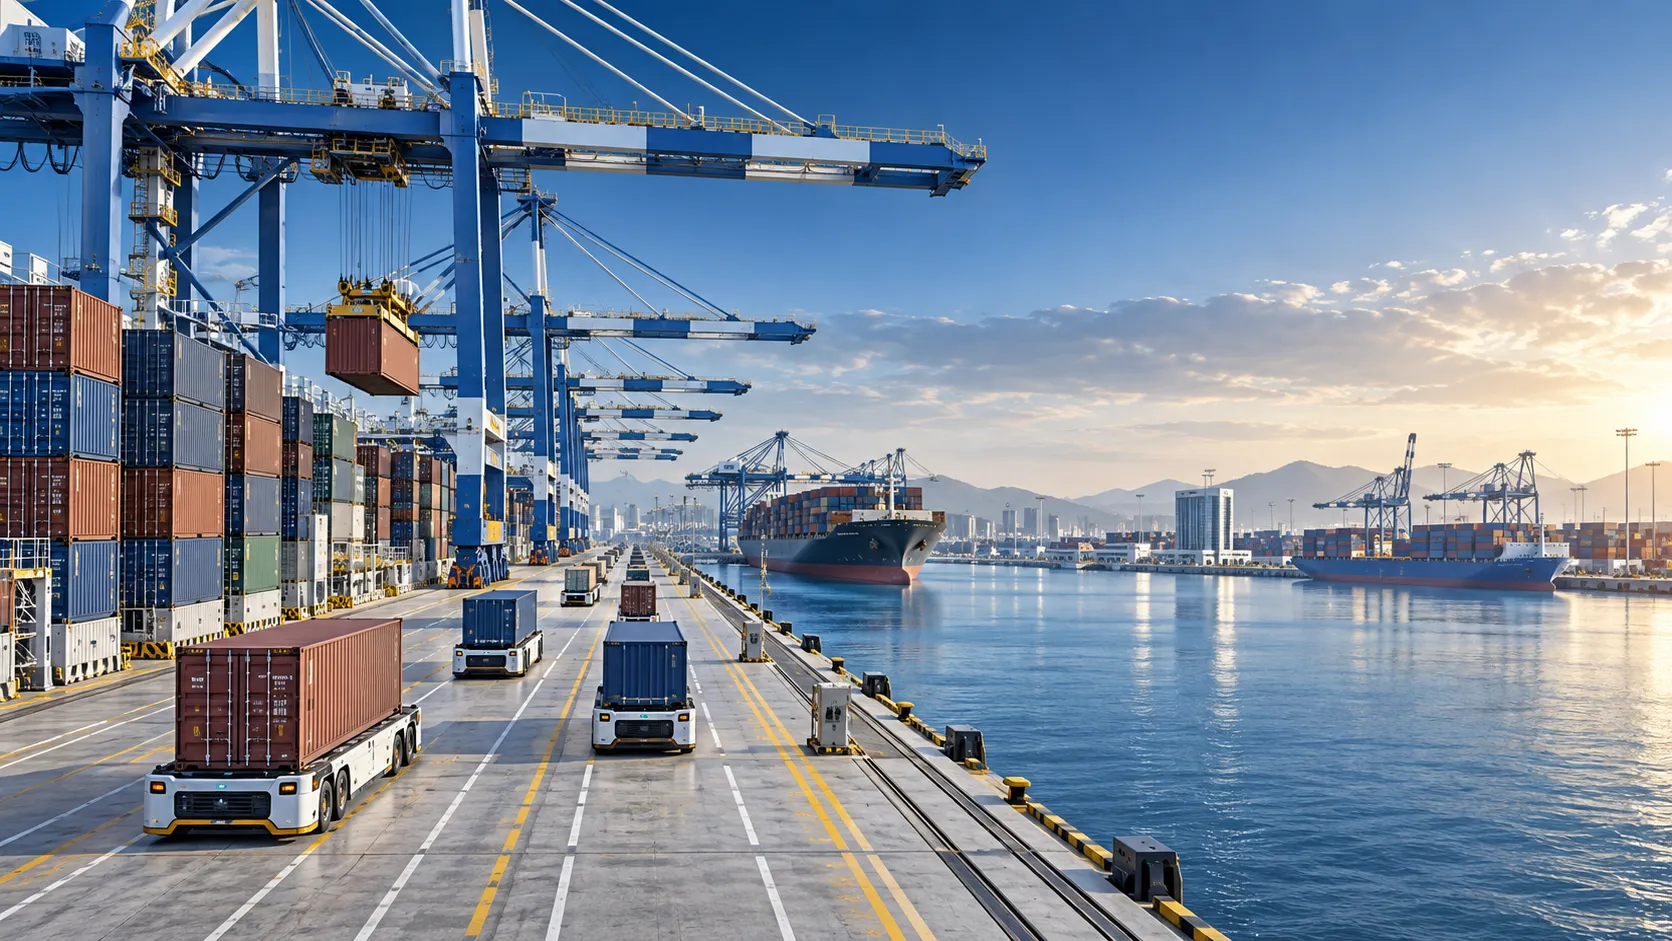
How to Evaluate Terminal Efficiency Solution Suppliers for High-Throughput Operations
Choose a terminal efficiency solutions supplier with confidence. Explore proven criteria for throughput, integration, lifecycle cost, safety, and reliable delivery.
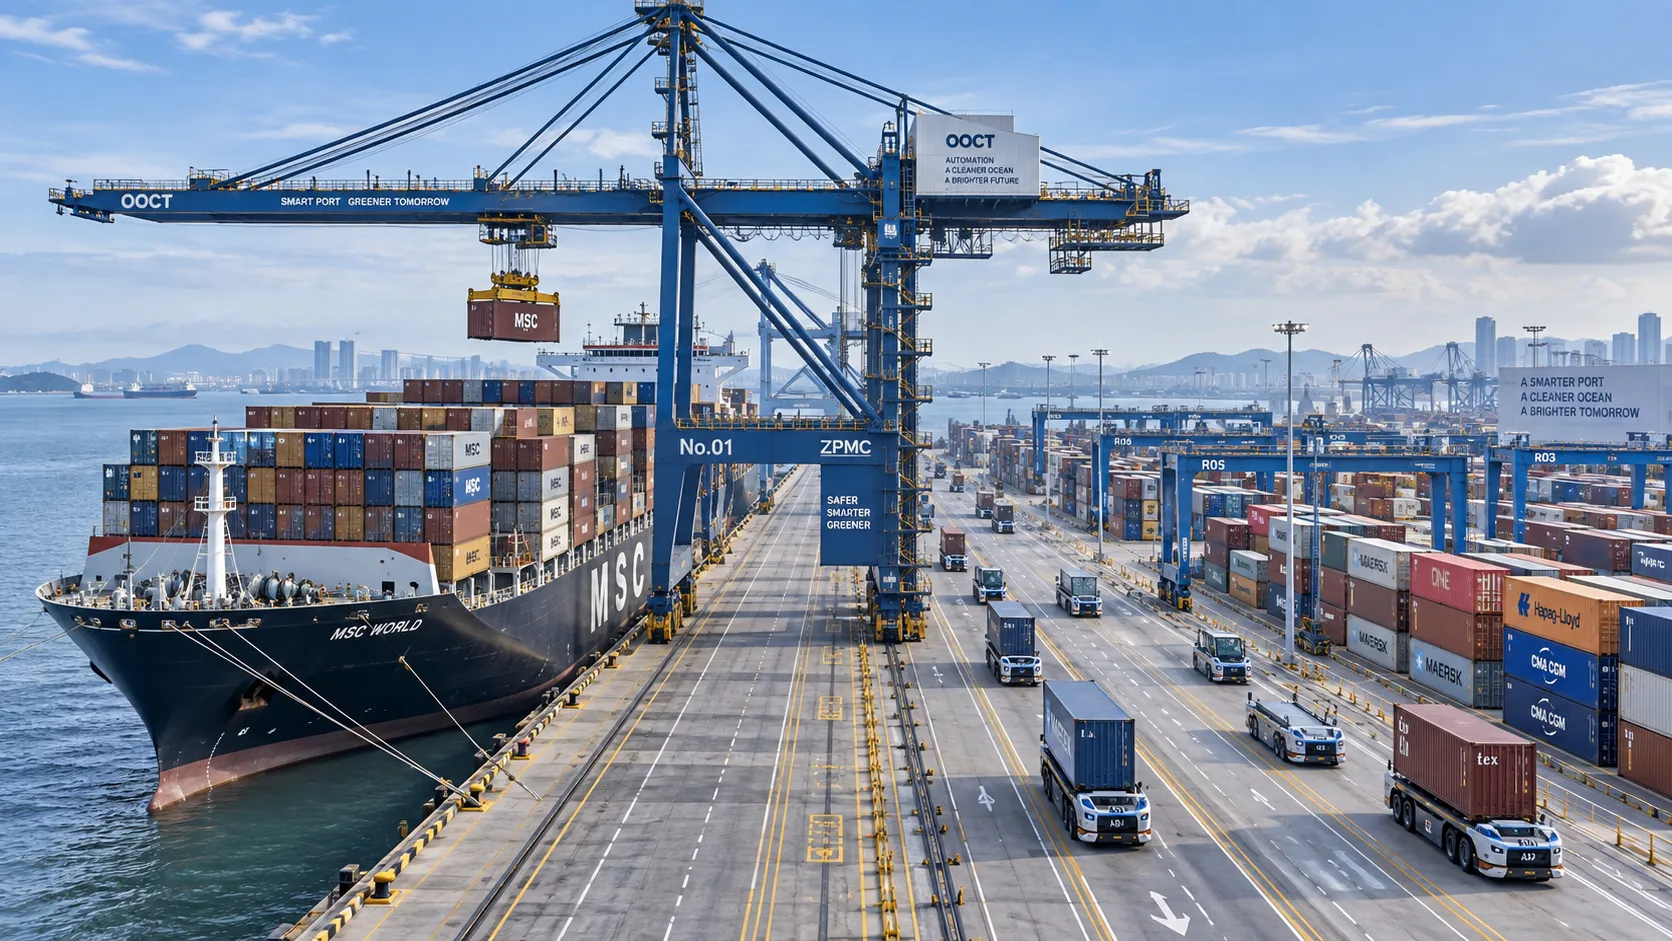
How to Specify a Quay Crane for Container Terminals by Vessel Size and Throughput?
Quay crane for container terminals: learn how to match outreach, lift height, capacity, automation, and cycle performance to vessel size and throughput goals.
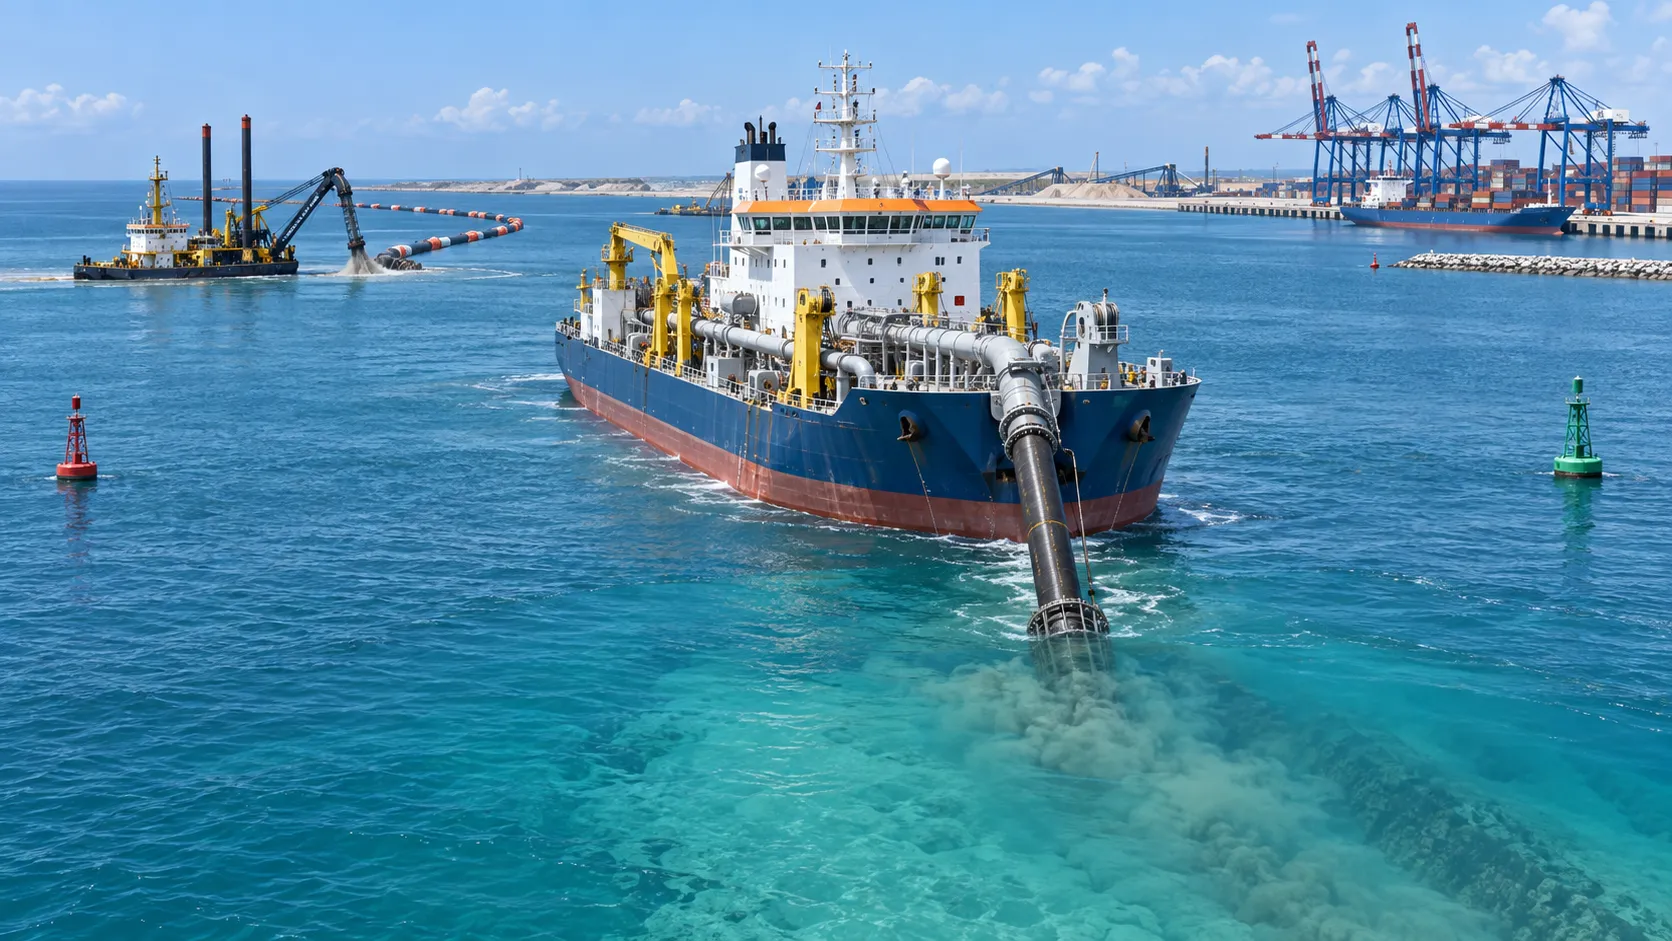
What Dredging Equipment Is Needed for Channel Deepening?
What dredging equipment is needed for channel deepening? Explore dredgers, pipelines, survey tools, and planning strategies for safer, more efficient port access.
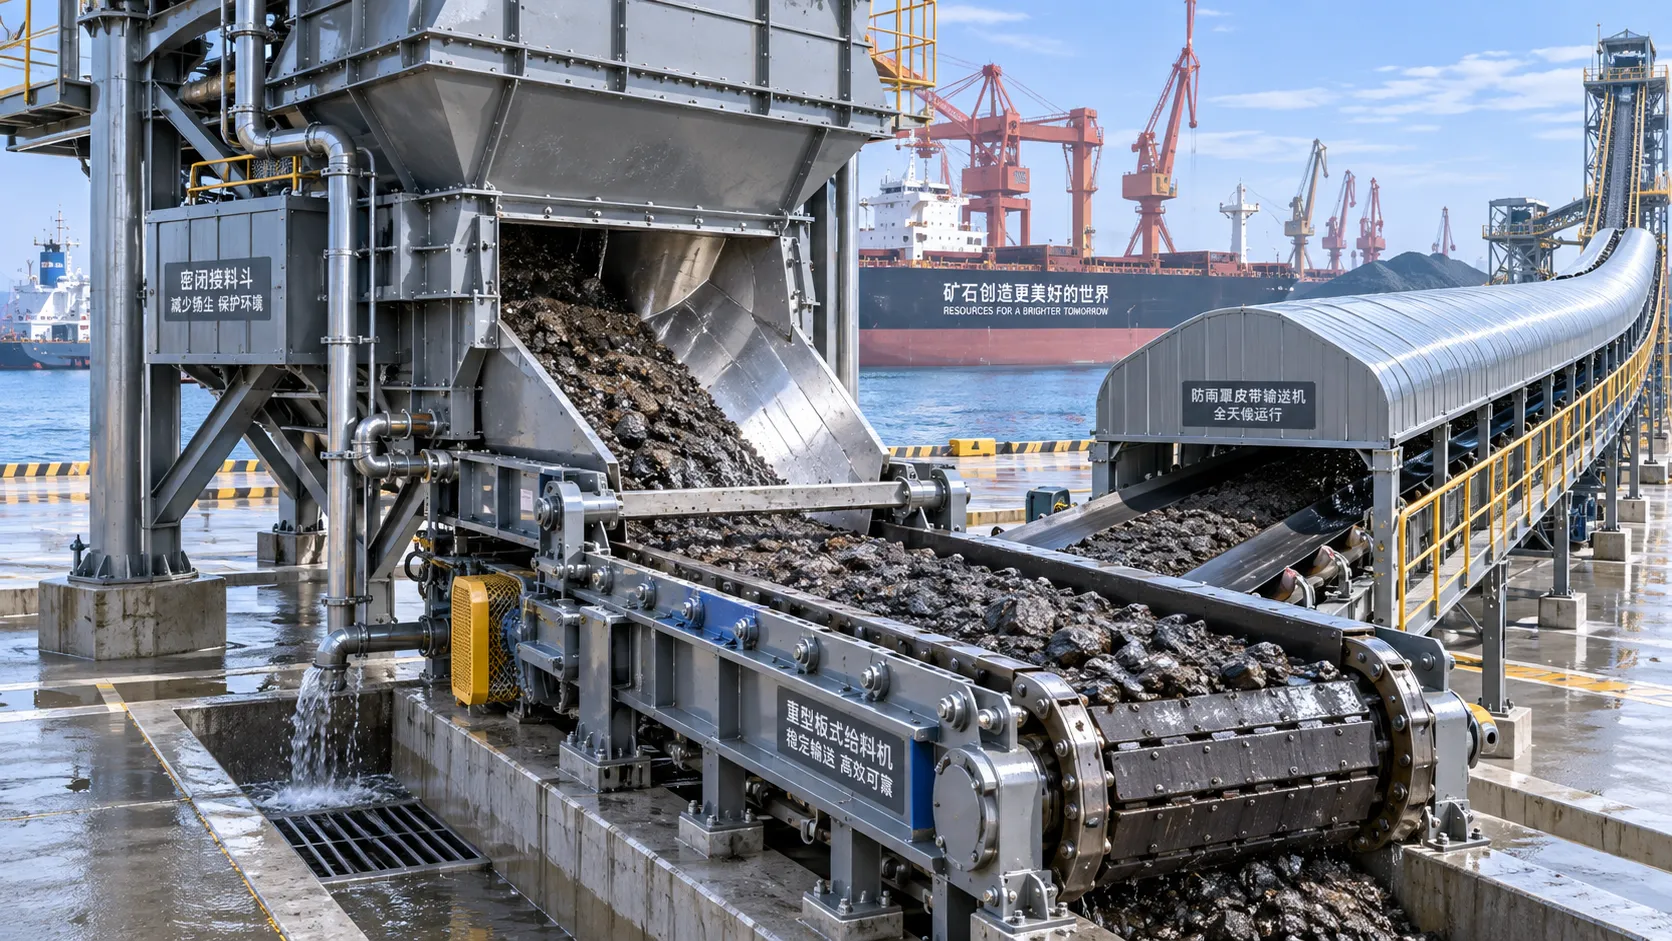
Which Bulk Handling Equipment Suits High-Moisture Cargo?
Which bulk handling equipment suits high-moisture cargo? Compare belt, apron, screw, drag, and slurry systems for reliable flow, less carryback, and higher terminal uptime.
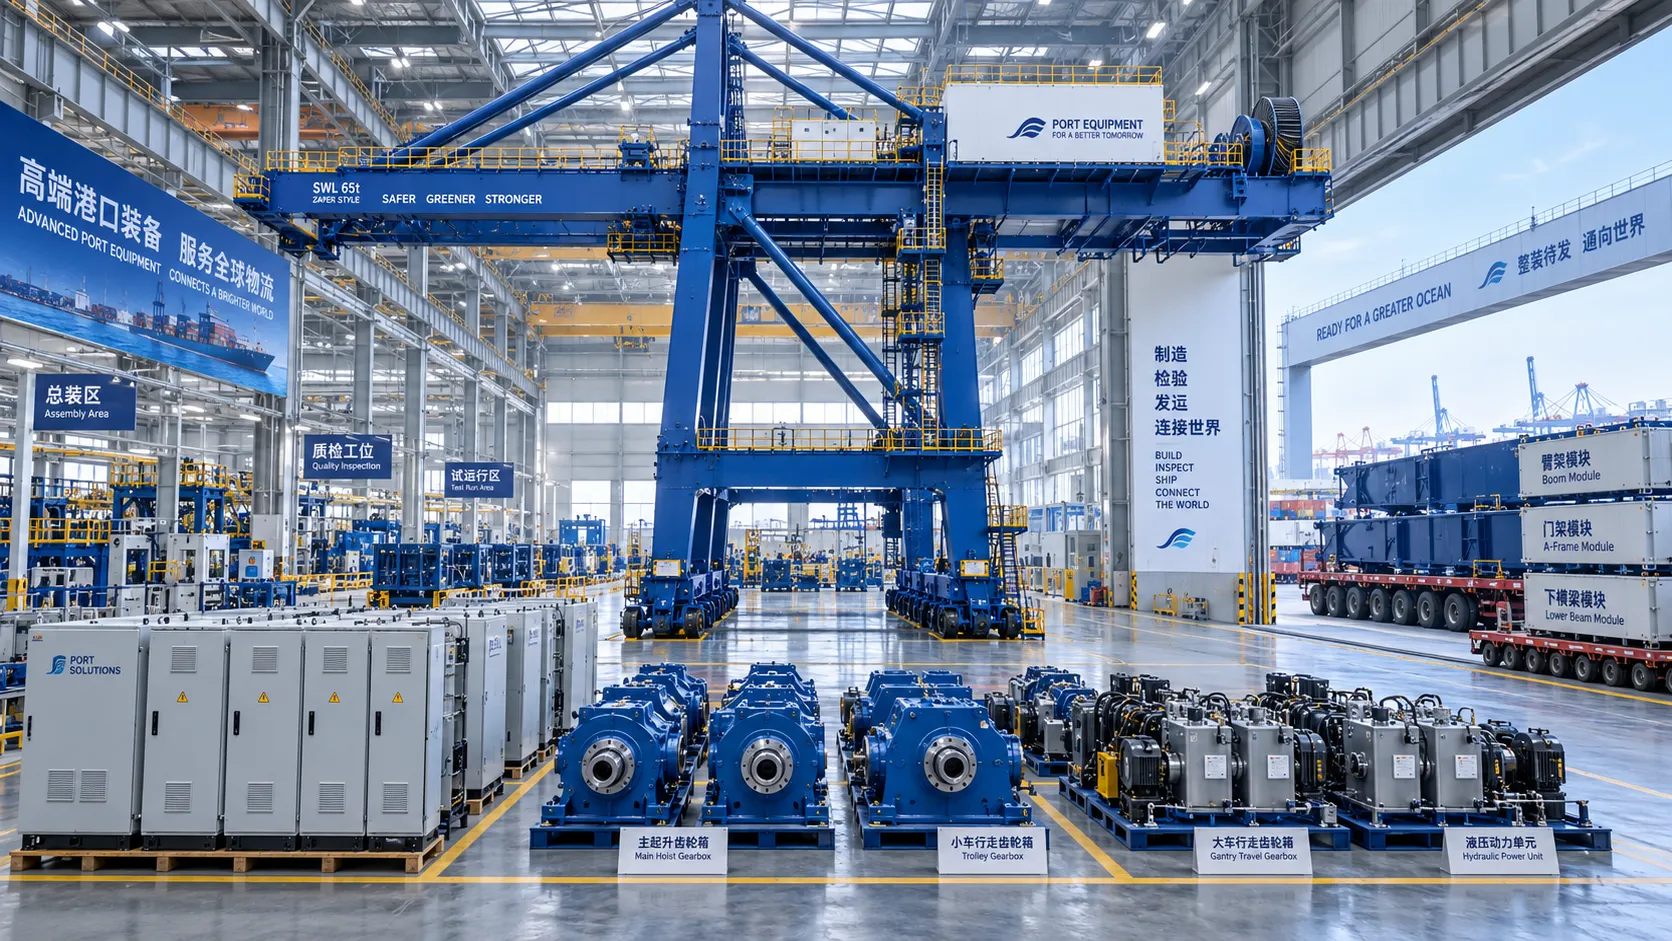
How Can Port Equipment Lead-Time Risk Be Managed?
How can port equipment lead-time risk be managed? Explore practical strategies to control critical paths, suppliers, transport, site readiness, and commissioning delays.
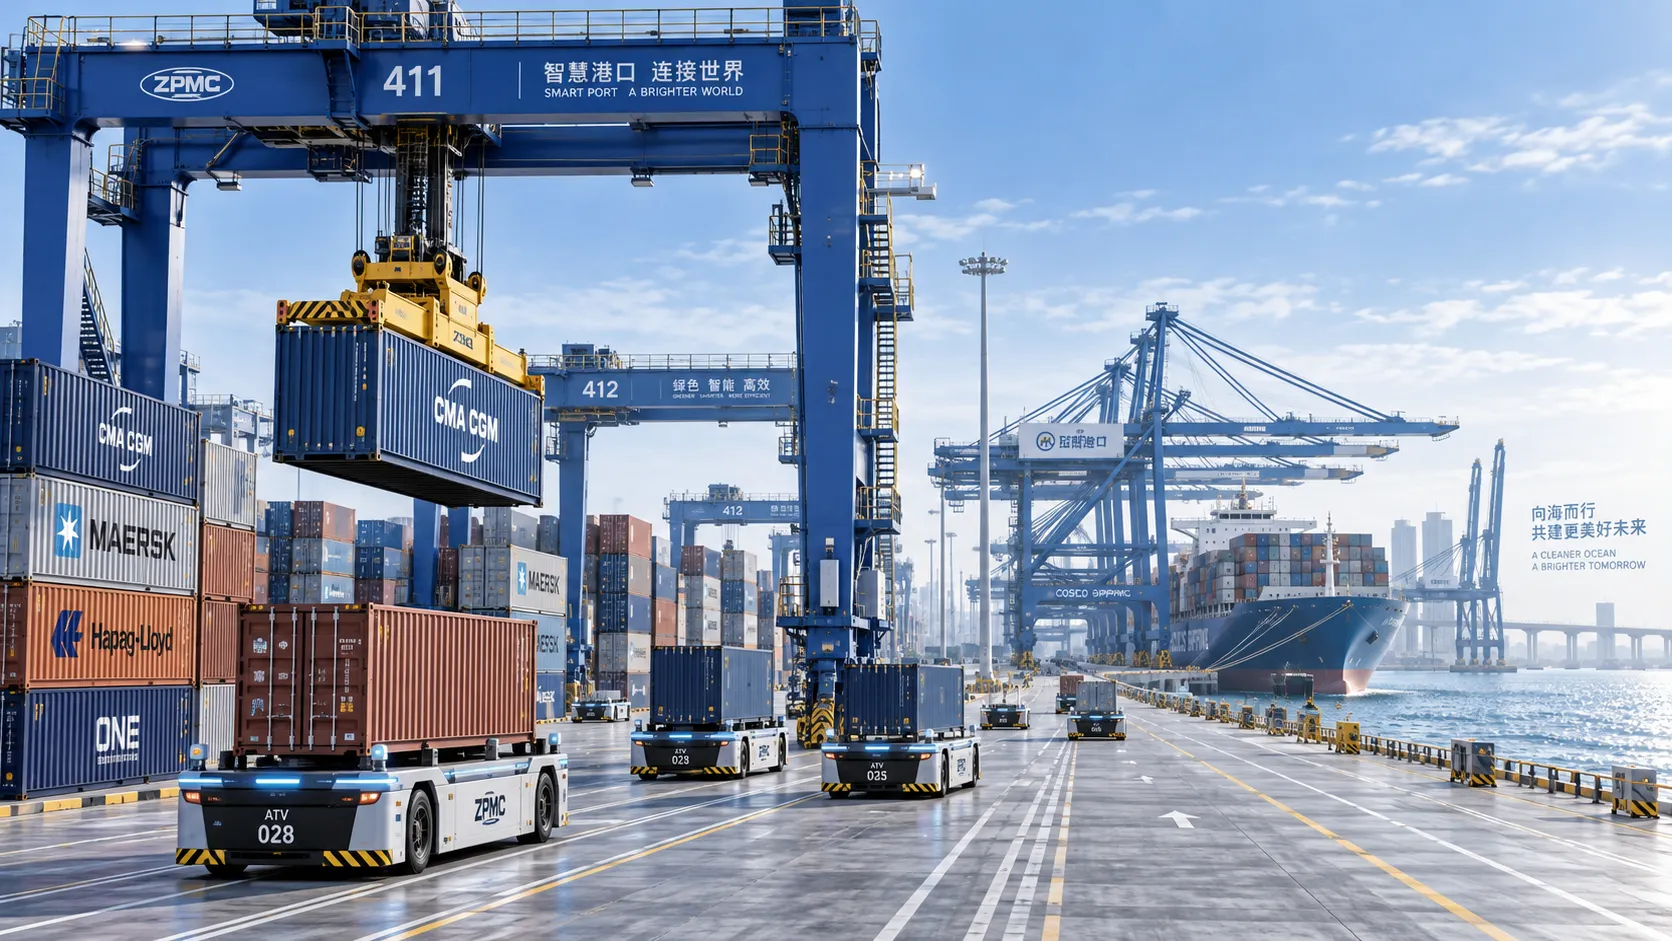
Terminal Automation Technologies That Raise Container Throughput Without Yard Disruption
Terminal automation technology that increases container throughput without disrupting yard flow. Explore smarter integration, resilient workflows, and phased deployment strategies.
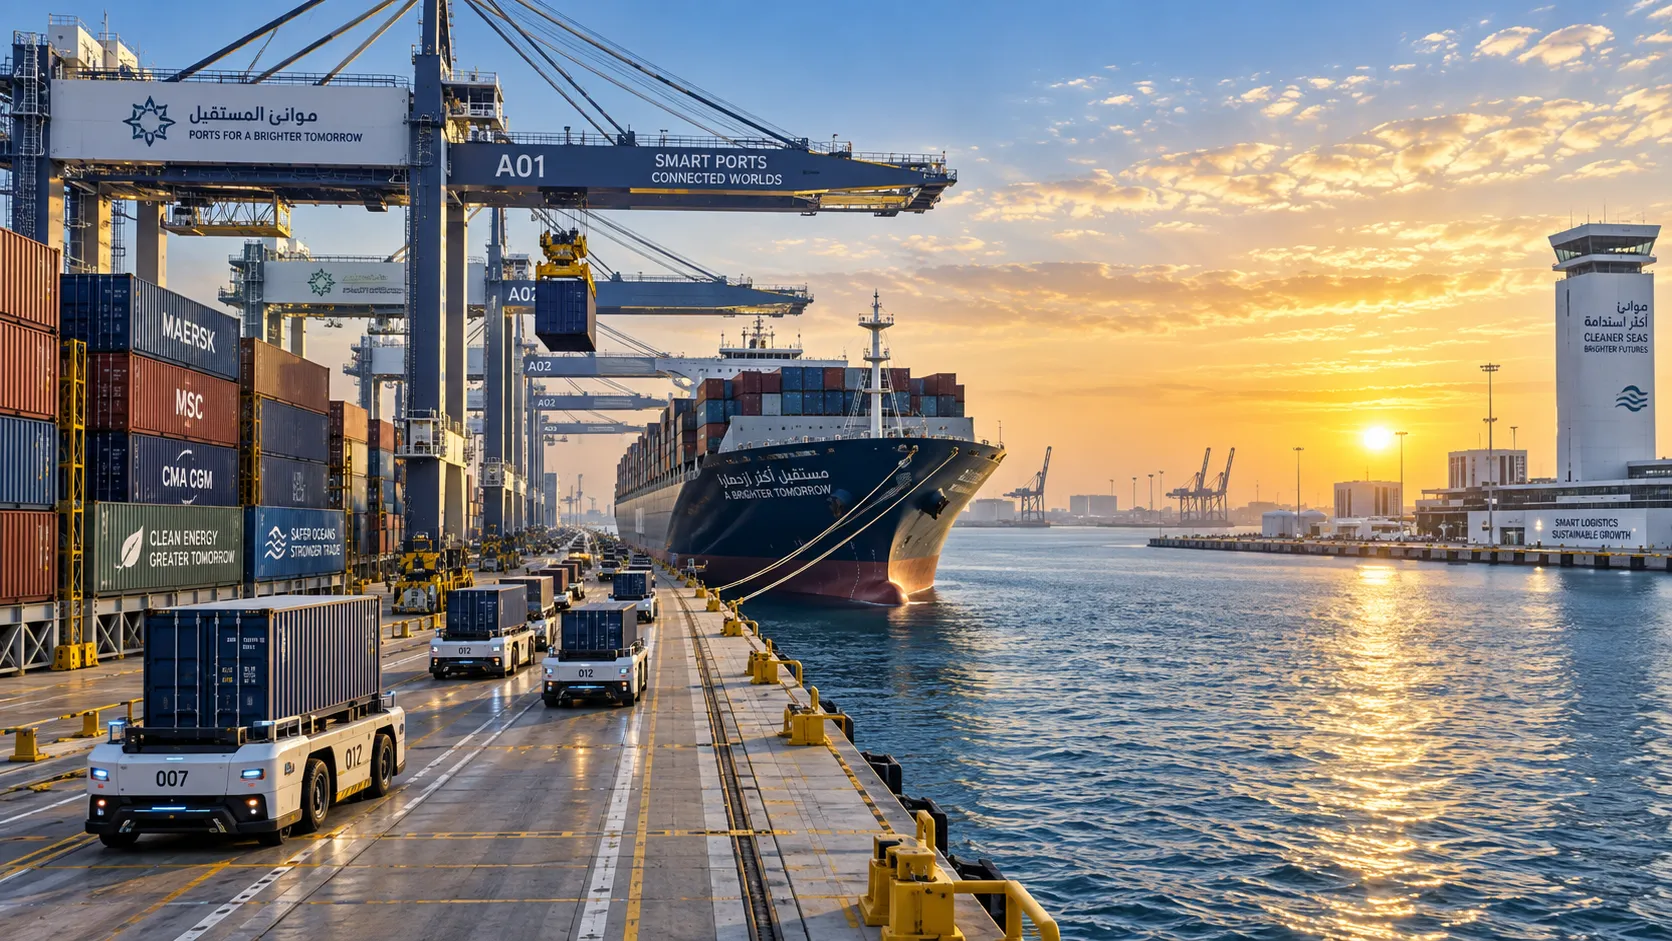
Middle East Port Automation: Key Market Drivers, Projects, and Investment Risks
Port automation systems Middle East: explore market drivers, flagship projects, integration challenges, and investment risks shaping smarter, resilient terminals.
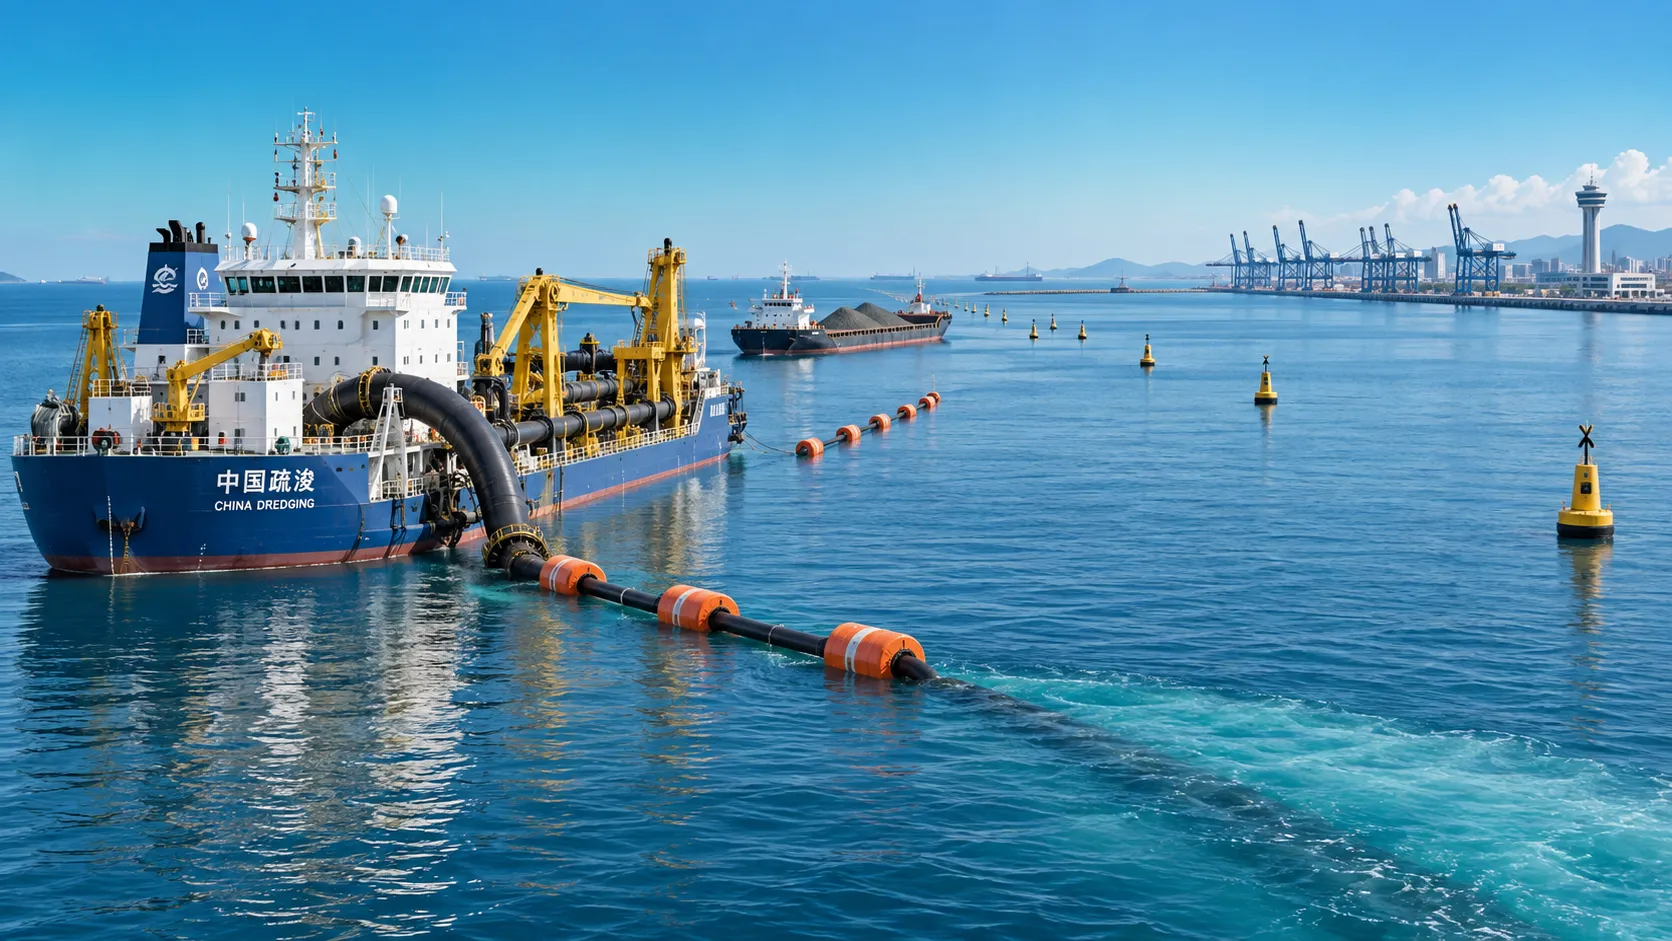
Planning Offshore Dredging Operations: Key Risks, Methods, and Project Controls
Offshore dredging operations demand smart planning. Explore key risks, proven methods, environmental controls, and project strategies for reliable delivery.