Related News
- 00
0000-00
Smart Port Systems Pricing: How to Compare Lifecycle Costs and ROI by Terminal Scale - 00
0000-00
What Drives Bulk Material Handling Pricing in Large Conveyor System Projects? - 00
0000-00
How Shipping Rate Analytics in Europe Help Importers Predict Costs and Route Risk - 00
0000-00
What Buyers Check When Reviewing Used PVC Coating Line Output and Condition - 00
0000-00
Automated Port Systems Cost Breakdown: CAPEX, Integration, and Maintenance Factors
What global shipping rates reveal about demand in 2026
Global shipping rates are more than freight benchmarks—they are early signals of trade momentum, inventory pressure, and infrastructure demand in 2026. For researchers tracking maritime logistics, this article examines how rate movements can reveal shifts in port activity, equipment utilization, and regional supply chain confidence, helping decode where global demand is strengthening, stalling, or structurally changing.
For B2B intelligence users, the value of global shipping rates goes well beyond estimating transport cost per FEU or bulk ton. Rate changes often surface 4 to 12 weeks before visible shifts appear in terminal throughput, berth congestion, crane utilization, yard density, or dredging schedules. In a market where port assets are capital intensive and infrastructure lead times can extend from 6 months to 36 months, early demand signals matter.
For PS-Nexus readers focused on terminal gear, automation systems, specialized handling, and marine engineering, the key question is not only whether rates are rising or falling. The deeper issue is what kind of demand those movements represent: temporary restocking, route disruption, commodity rotation, regional manufacturing migration, or structural upgrades in maritime logistics capacity.
How global shipping rates function as a forward indicator in 2026
In 2026, global shipping rates should be read as a layered signal rather than a single market verdict. A 15% increase in spot container prices over 3 to 5 weeks may indicate stronger export bookings, but it can also reflect weather disruption, canal constraints, blank sailings, or equipment imbalances. Researchers need to separate cyclical demand from operational friction.
That distinction is critical for maritime infrastructure planning. If rate pressure is driven by vessel bunching and yard saturation, the implication is different from a broad-based rise in sustained contract rates across 2 or 3 quarters. One points to short-term operational stress; the other may justify stronger investment in quay cranes, automated stacking systems, truck appointment logic, or channel deepening.
What rate movements usually capture first
The earliest effects of changing global shipping rates often appear in four areas: booking urgency, equipment repositioning, route reliability, and port dwell time. A sudden tightening of vessel space can emerge in less than 14 days, while inland inventory correction may take 30 to 90 days to show up in import volumes.
- Booking compression: exporters move cargo earlier to secure slots.
- Container imbalance: empty repositioning costs rise across key corridors.
- Terminal pressure: yard occupancy can move from 65% to above 80% quickly.
- Asset scheduling shifts: cranes, AGVs, and gate systems face uneven peaks.
Why spot and contract rates tell different stories
Spot rates react quickly and are useful for detecting immediate sentiment. Contract rates move slower, often over quarterly or annual negotiation cycles, and are better for judging confidence in medium-term cargo demand. When both rise together across Asia-Europe, Transpacific, and selected South-South routes, the signal is stronger than when only spot markets jump.
For terminal and equipment stakeholders, this difference affects procurement timing. A short-lived spot spike may justify temporary labor, software tuning, or berth coordination. A durable contract-rate recovery is more relevant for decisions involving RTGs, RMGs, ship-to-shore cranes, automated yard blocks, bulk conveyor upgrades, or dredging support capacity.
The table below shows how different patterns in global shipping rates can be interpreted by maritime logistics researchers and infrastructure decision teams.
The main takeaway is that global shipping rates only become useful demand indicators when paired with time horizon and route context. Researchers should avoid reading a 1-week spike as structural growth. The stronger signal comes from persistence across 6 to 12 weeks and confirmation from utilization, congestion, and equipment deployment data.
What rising or falling rates reveal about port activity and equipment demand
When global shipping rates move, port infrastructure does not respond uniformly. A rate increase on East-West container lanes may lift demand for ship-to-shore cranes and automated yard orchestration, while higher bulk freight levels may shift attention toward stacker-reclaimers, hopper systems, grab unloaders, and dust-controlled conveyor lines.
This matters because maritime trade is not one market. In 2026, demand visibility depends on whether cargo growth is containerized, energy-related, project cargo based, or linked to nearshoring and regional manufacturing shifts. Each pattern changes the load profile of terminals and the required mix of mechanical and digital assets.
Container terminals: when rates point to automation stress or opportunity
A sustained rise in global shipping rates for container lanes can signal that ports will face tighter berth windows, denser yards, and more volatile truck peaks. Once average yard occupancy pushes past 75% to 80%, many terminals experience rising rehandle intensity, slower truck turn times, and less tolerance for manual planning delays.
At that threshold, the demand signal may shift from pure capacity to control quality. Terminal operators often need better TOS integration, low-latency remote crane control, AGV path planning, or exception-handling logic rather than simply buying more steel. For intelligence users, that is an important clue: higher global shipping rates can reveal software demand as much as hardware demand.
Bulk and energy logistics: rates as a proxy for industrial appetite
Bulk freight indicators often reflect industrial consumption more directly than container markets. If dry bulk rates strengthen for 8 to 12 consecutive weeks while container rates remain soft, the likely story is commodity restocking, power-sector demand, or raw material rotation. That pattern has different implications for coastal terminals and inland transfer chains.
For port equipment suppliers and distributors, it may point toward stronger demand for bulk handling machinery, conveyor reliability upgrades, and berth deepening support. It can also indicate where dredging engineering becomes strategically relevant, especially at ports managing draft-sensitive vessels or channel expansion programs.
Dredging and marine engineering: the hidden layer behind rate signals
Not every rate increase justifies new terminal equipment. In some regions, the bottleneck is nautical access. If vessels queue because draft limits, sedimentation, or turning-basin constraints reduce usable capacity, freight markets may tighten even before terminal-side utilization looks extreme. In such cases, channel maintenance intervals of 6 to 18 months become part of the demand story.
Researchers evaluating global shipping rates should therefore ask a second-order question: is the infrastructure issue landside, quay-side, or waterside? The answer changes whether the likely beneficiaries are crane suppliers, automation integrators, bulk system providers, or dredging equipment planners.
The next table connects rate behavior with likely infrastructure pressure points across different maritime logistics segments.
This mapping helps intelligence teams move from freight pricing to operational interpretation. In practice, global shipping rates are most valuable when linked to a specific bottleneck type. That connection improves forecasting for distributors, investors, engineering teams, and procurement managers watching long-cycle port infrastructure demand.
How researchers should read rate signals without overreacting
One of the most common errors in maritime analysis is treating global shipping rates as a stand-alone demand index. Rates are sensitive, but they are noisy. In 2026, a disciplined research framework should combine at least 5 variables: rate direction, duration, route spread, congestion evidence, and infrastructure utilization. Without that structure, signals can be misread.
A practical 5-step reading model
- Check whether the move lasts more than 3 to 4 weeks.
- Compare at least 2 trade lanes or cargo categories.
- Test for operational confirmation such as waiting time or yard density.
- Identify whether the trigger is demand-led, policy-led, or disruption-led.
- Map the signal to the correct infrastructure layer: marine access, berth, yard, or hinterland.
Common misreadings in 2026
A rising rate does not always mean healthy trade expansion. It may reflect route reduction, insurance friction, fuel cost pass-through, or port omission patterns. Likewise, a declining rate does not always mean weak end demand. If vessel capacity has been restored faster than cargo volume, prices may normalize while throughput remains stable.
For information researchers, the best approach is to treat global shipping rates as an alert system, not a final answer. Once an alert appears, secondary indicators should be reviewed over a 30-day, 60-day, and 90-day window to determine whether the movement is fading, spreading, or becoming structural.
Indicators that strengthen confidence in the signal
- Berth waiting time consistently above normal operating bands.
- Yard occupancy sustained above 75% for several weekly cycles.
- Higher empty repositioning activity across export-heavy regions.
- Stronger equipment maintenance utilization due to longer operating hours.
- Dredging or marine access interventions becoming more frequent.
When 3 or more of these indicators align with rate movement, the probability of a meaningful demand shift is higher. That is especially relevant for PS-Nexus users assessing long-cycle opportunities in smart ports, automated terminals, and blue economy infrastructure.
What this means for procurement, distribution, and strategic planning
For buyers and channel partners in port equipment and marine engineering, global shipping rates can improve timing. They help determine whether market attention should be on expansion, retrofit, maintenance, or digital optimization. In many cases, the smartest response to rate volatility is not immediate capacity spending but targeted system reinforcement over a 90- to 180-day planning horizon.
Distributors can also use rate patterns to sharpen sector positioning. If rate strength is concentrated in bulk corridors, demand narratives should emphasize material flow reliability, corrosion resistance, dust control, and uptime. If container lanes are driving the shift, the focus may move toward automation compatibility, yard choreography, remote operations, and energy-efficient equipment cycles.
Three planning responses that usually outperform reactive buying
- Build scenario bands: base case, disruption case, and sustained demand case over 2 to 3 quarters.
- Separate must-have upgrades from optional expansion projects using utilization thresholds.
- Link commercial strategy to operational proof points such as turnaround time, dwell reduction, or draft accessibility.
Why intelligence quality matters
In maritime logistics, poor interpretation can be costly. A crane order, yard retrofit, or dredging support program may involve long lead times and complex approval chains. That is why market participants need stitched intelligence that connects freight movements with equipment stress, algorithmic scheduling needs, and coastal engineering realities.
At this level, global shipping rates become more than freight data. They become a practical filter for identifying where the next wave of terminal gear demand, automation investment, and marine infrastructure pressure is likely to emerge.
In 2026, the most useful reading of global shipping rates is nuanced rather than binary. Rates can reveal where trade confidence is rebuilding, where congestion is masking weak cargo pull, and where infrastructure constraints are creating demand for smarter handling systems or marine engineering support. For researchers, suppliers, and strategic decision-makers, the opportunity lies in translating freight signals into asset-level insight.
PS-Nexus helps connect those dots across terminal gear, automated container handling, bulk systems, and dredging engineering intelligence. If you need deeper interpretation of rate movements, infrastructure implications, or market-entry priorities, contact us to explore tailored intelligence support, request a custom research brief, or learn more solutions for smart port decision-making.
Related News
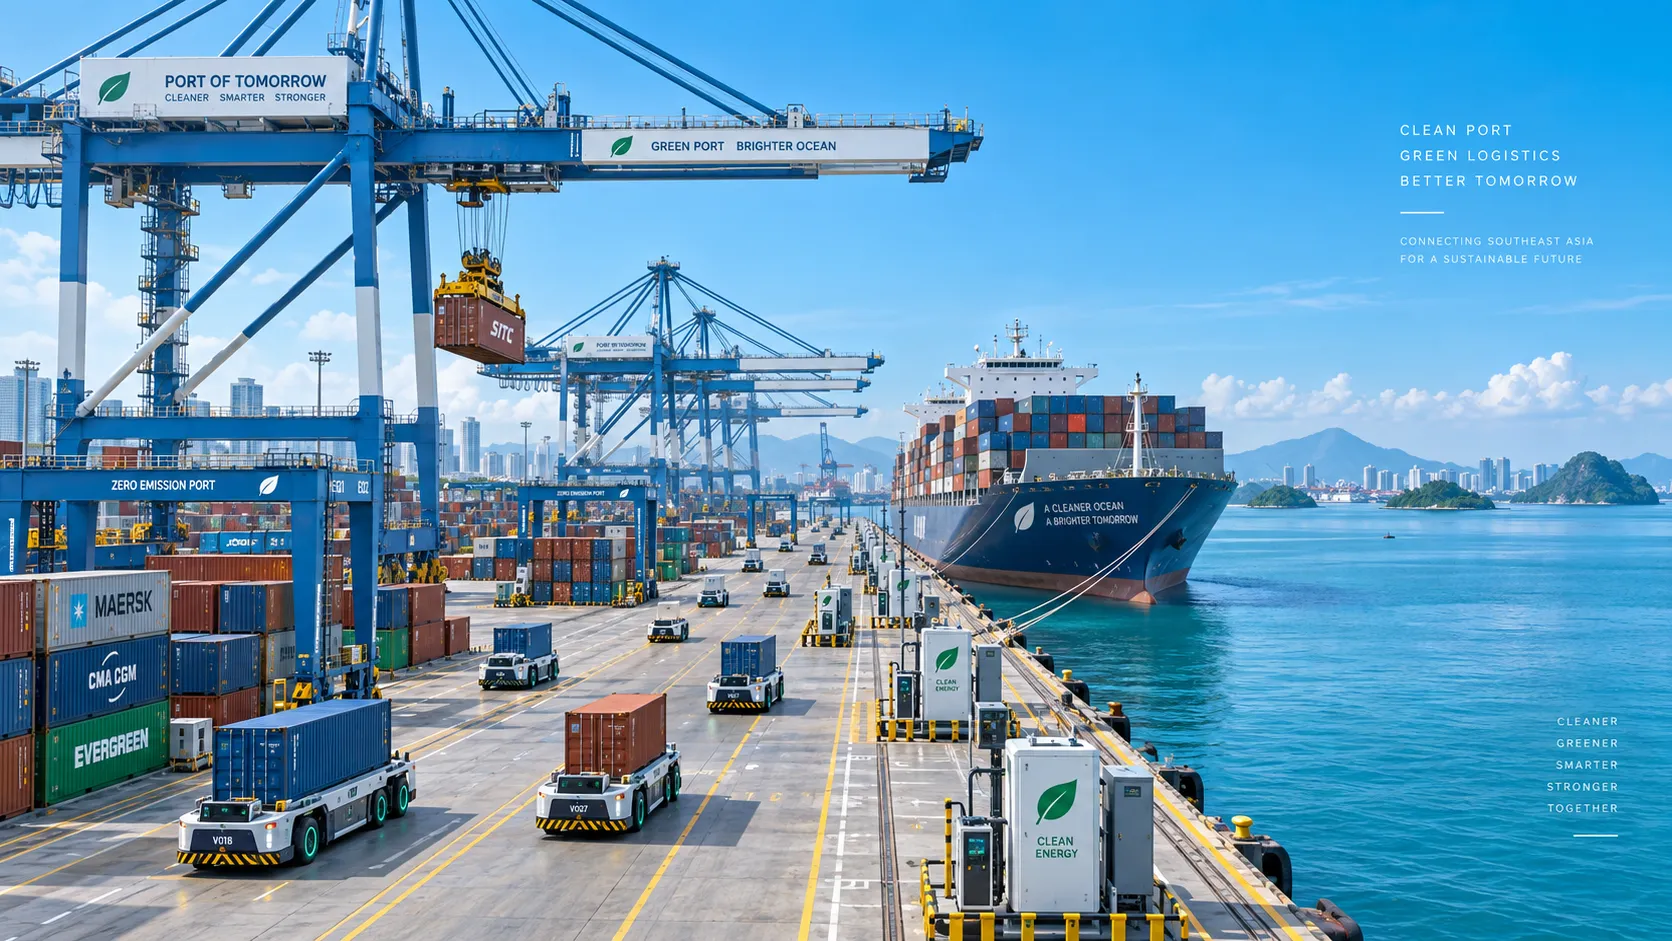
Smart Port Systems in Southeast Asia: Investment Priorities and Adoption Barriers
Smart port systems Southeast Asia: discover investment priorities, adoption barriers, and practical steps to build resilient, connected, high-performing terminals.

How to Evaluate Terminal Efficiency Solution Suppliers for High-Throughput Operations
Choose a terminal efficiency solutions supplier with confidence. Explore proven criteria for throughput, integration, lifecycle cost, safety, and reliable delivery.
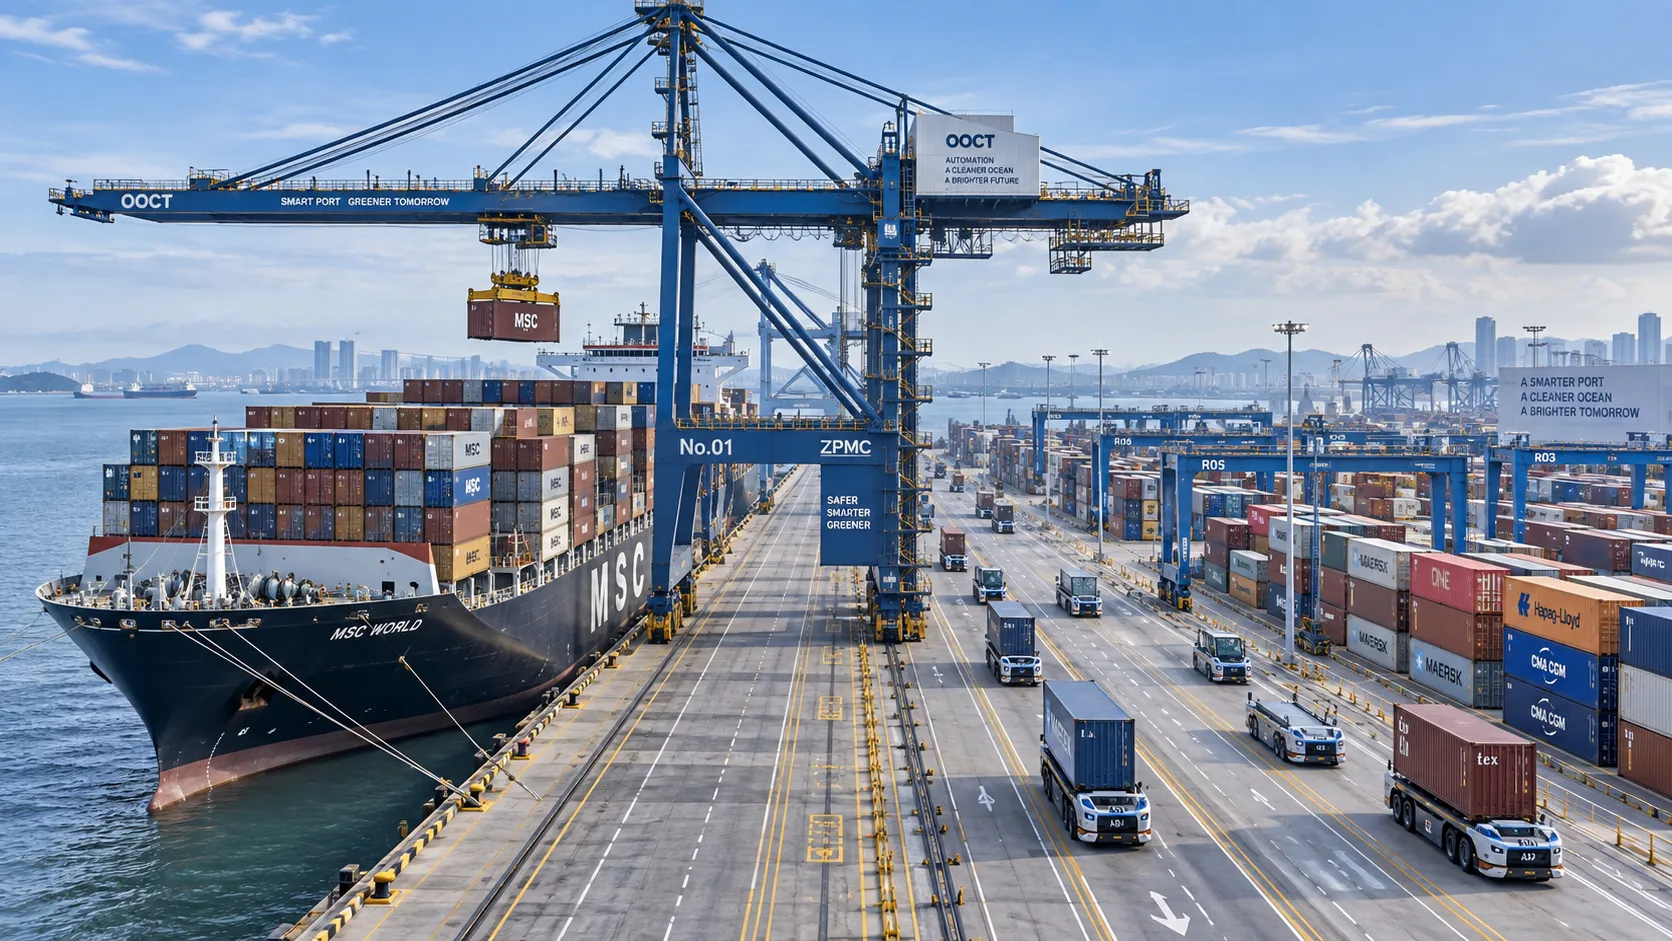
How to Specify a Quay Crane for Container Terminals by Vessel Size and Throughput?
Quay crane for container terminals: learn how to match outreach, lift height, capacity, automation, and cycle performance to vessel size and throughput goals.
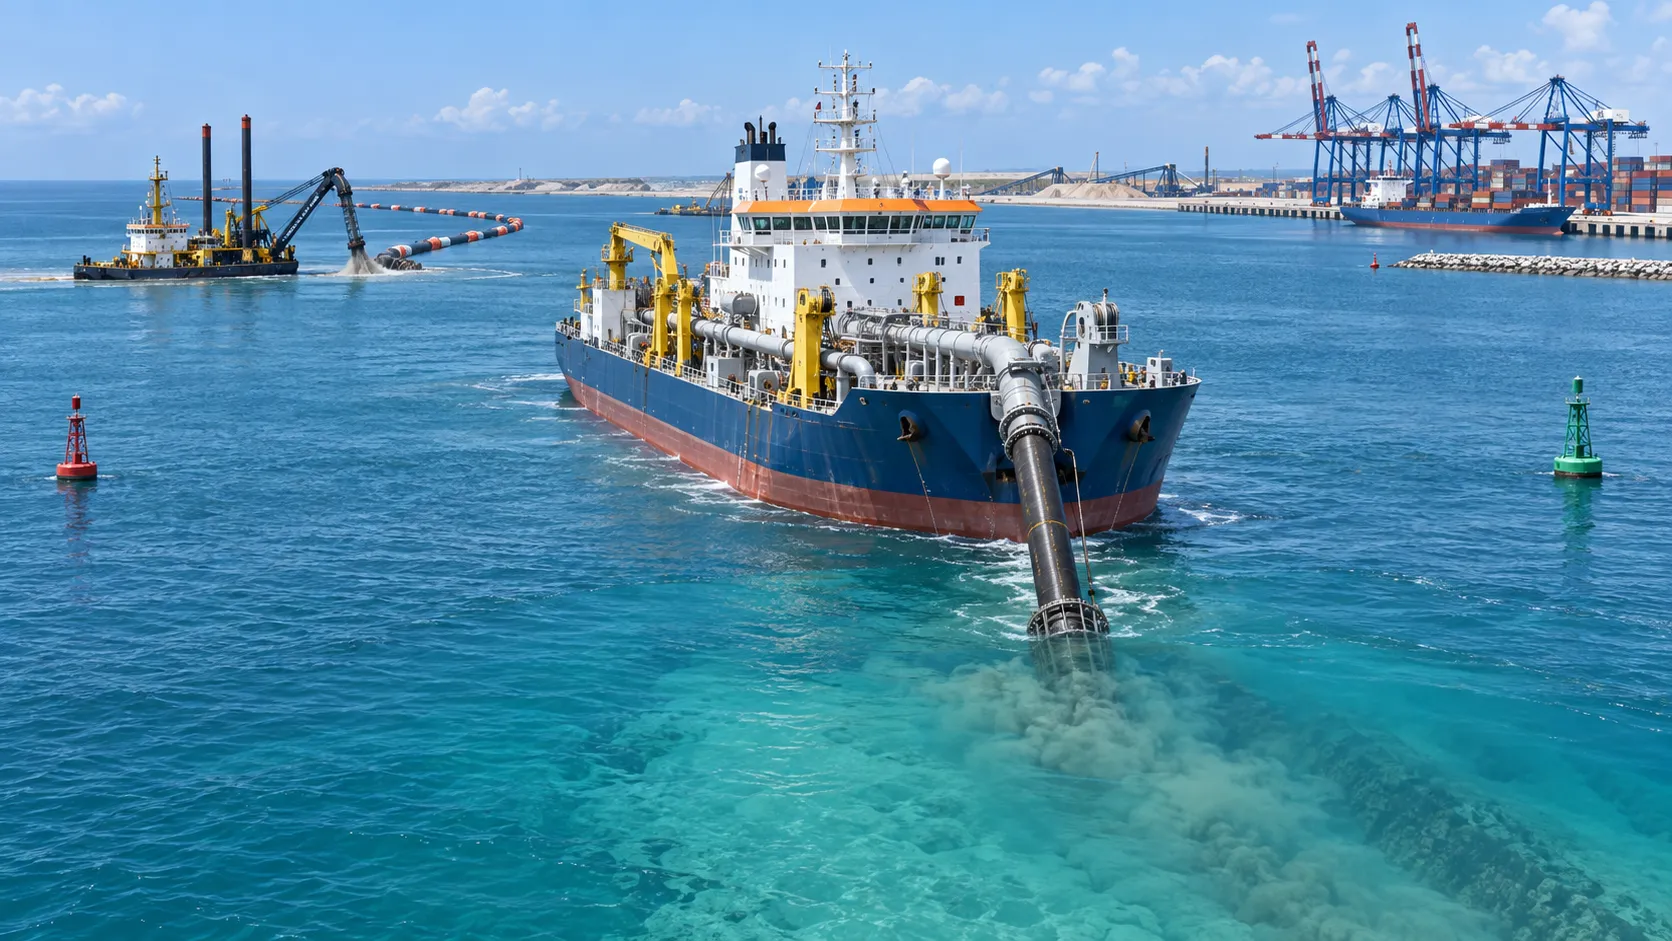
What Dredging Equipment Is Needed for Channel Deepening?
What dredging equipment is needed for channel deepening? Explore dredgers, pipelines, survey tools, and planning strategies for safer, more efficient port access.

Which Bulk Handling Equipment Suits High-Moisture Cargo?
Which bulk handling equipment suits high-moisture cargo? Compare belt, apron, screw, drag, and slurry systems for reliable flow, less carryback, and higher terminal uptime.
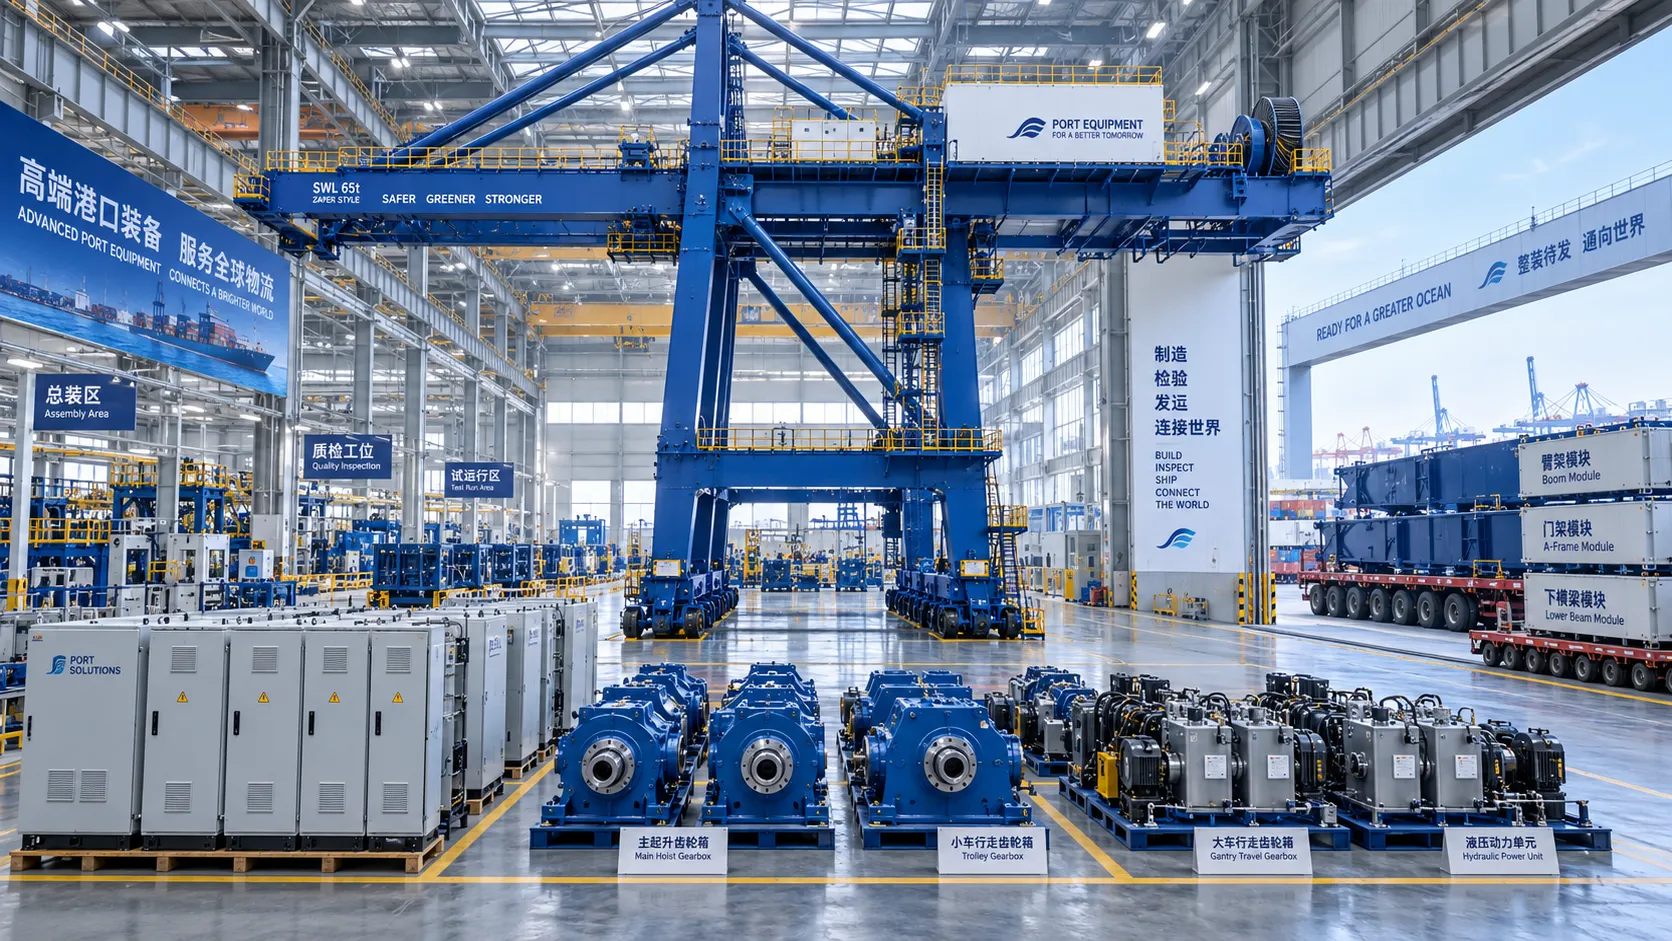
How Can Port Equipment Lead-Time Risk Be Managed?
How can port equipment lead-time risk be managed? Explore practical strategies to control critical paths, suppliers, transport, site readiness, and commissioning delays.
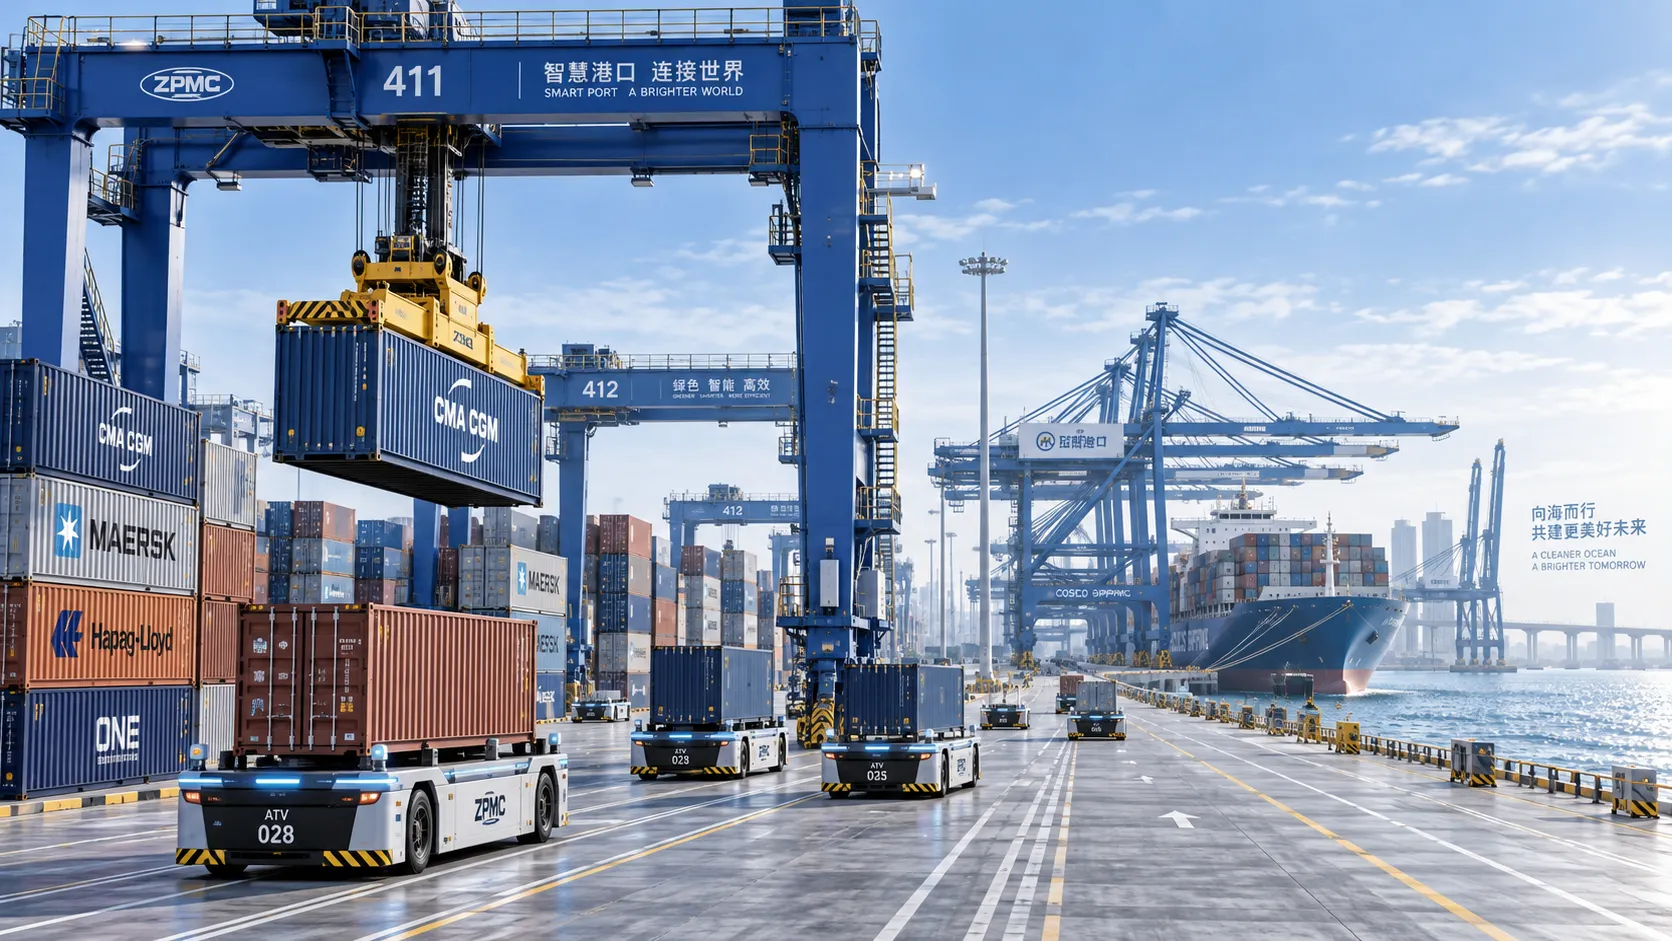
Terminal Automation Technologies That Raise Container Throughput Without Yard Disruption
Terminal automation technology that increases container throughput without disrupting yard flow. Explore smarter integration, resilient workflows, and phased deployment strategies.
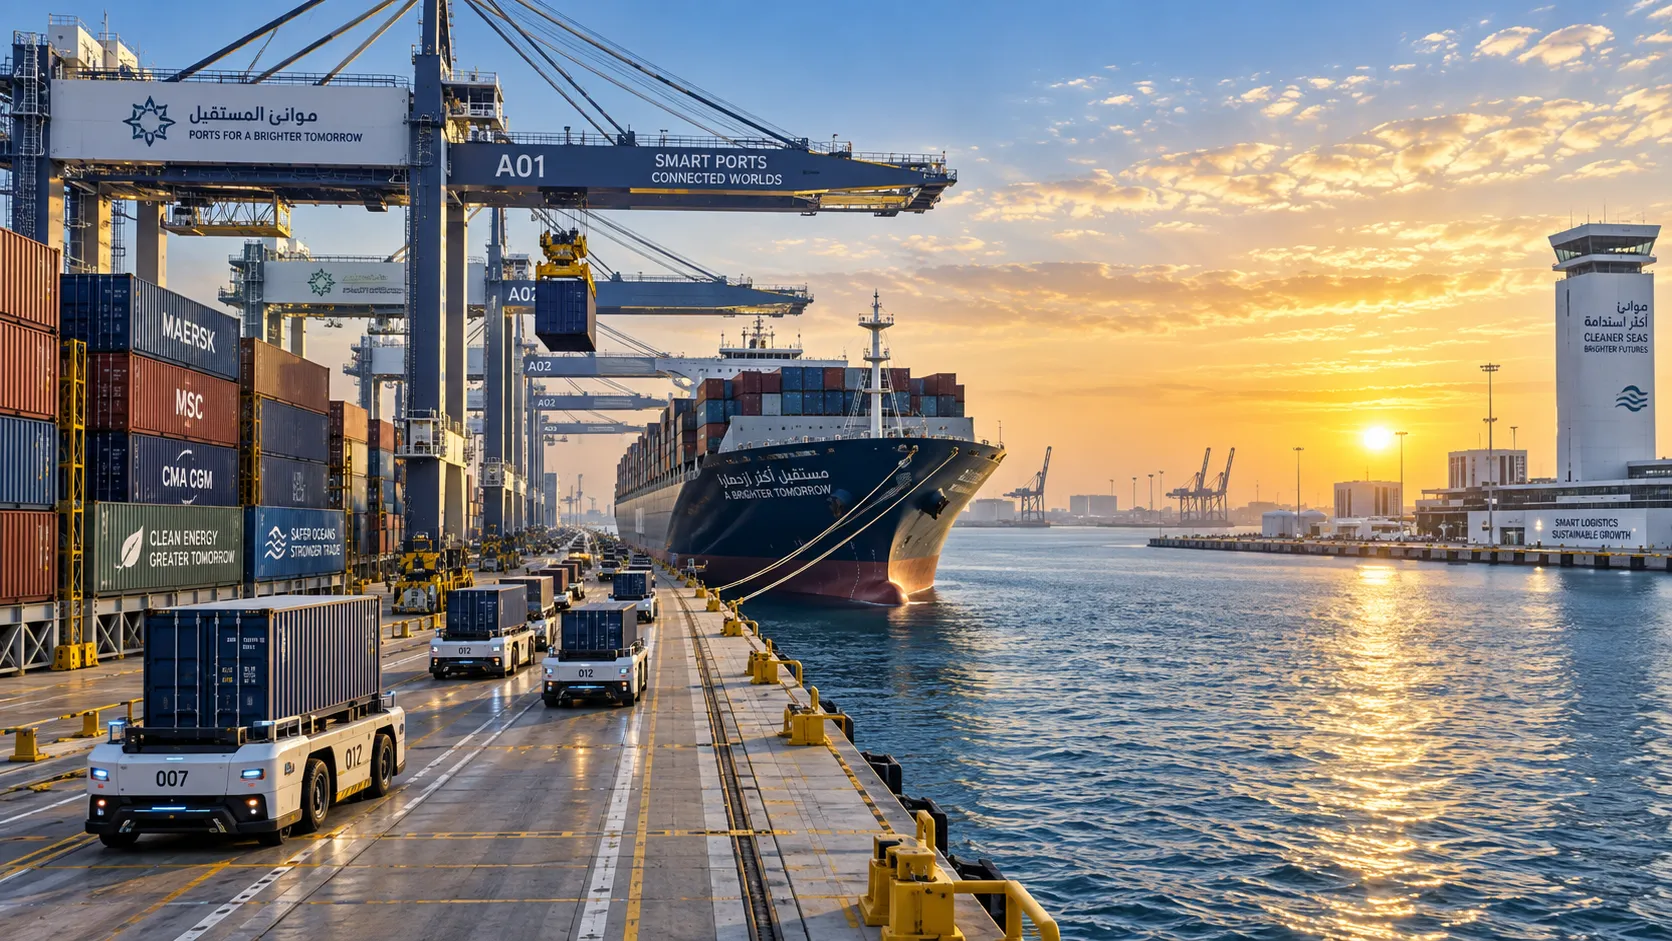
Middle East Port Automation: Key Market Drivers, Projects, and Investment Risks
Port automation systems Middle East: explore market drivers, flagship projects, integration challenges, and investment risks shaping smarter, resilient terminals.
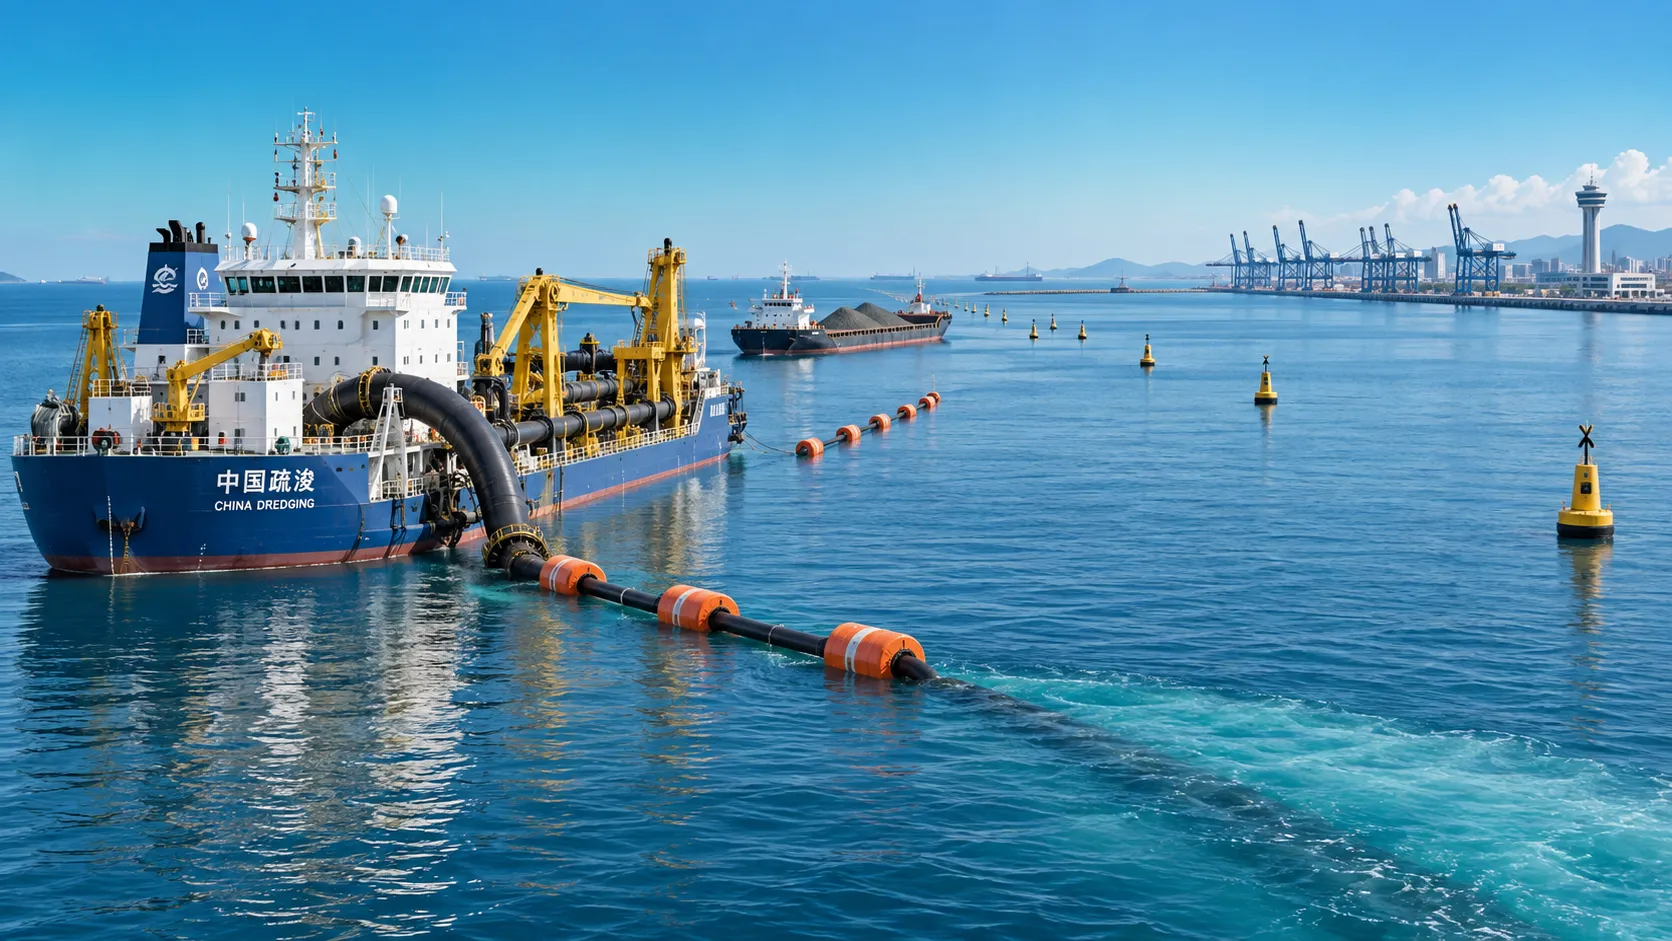
Planning Offshore Dredging Operations: Key Risks, Methods, and Project Controls
Offshore dredging operations demand smart planning. Explore key risks, proven methods, environmental controls, and project strategies for reliable delivery.