Related News
- 00
0000-00
Smart Port Systems in Southeast Asia: Investment Priorities and Adoption Barriers - 00
0000-00
Middle East Port Automation: Key Market Drivers, Projects, and Investment Risks - 00
0000-00
How Coastal Cities Can Prioritize Blue Economy Projects for Jobs and Ecosystem Gains - 00
0000-00
How Harbor Construction Solutions Address Wave Loads, Scour, and Vessel Berthing - 00
0000-00
What Is Driving Maritime Infrastructure Growth in Southeast Asia?
Smart operations solutions are changing port response times
Across modern terminals, smart operations solutions are redefining how fast ports detect bottlenecks, coordinate equipment, and respond to shifting cargo flows. For operators on the ground, this means clearer visibility, faster dispatch decisions, and fewer delays across cranes, yards, and vessel handling. As pressure grows for efficiency, automation, and resilience, understanding these systems is becoming essential to improving port response times.
For port users and equipment operators, response time is no longer measured only by how quickly a machine starts moving. It is also shaped by data latency, task allocation logic, yard density, berth pressure, and how well terminal systems connect people, assets, and workflows. In practical terms, a 3-minute delay in crane assignment or a 20-second gap in vehicle routing can cascade into longer vessel turnaround, truck congestion, and lower berth productivity.
This is why smart operations solutions have become central to port performance. At PS-Nexus, the focus is not just on automation as a concept, but on the operational intelligence that links quay cranes, AGVs, yard equipment, bulk handlers, dredging support systems, and control platforms into a coordinated response framework. For frontline operators, the value is direct: fewer blind spots, faster exception handling, and better use of every operating hour in a 24/7 environment.
What Smart Operations Solutions Actually Change at the Terminal Level
In a conventional terminal, response depends heavily on manual reporting, radio communication, and supervisor judgment. That model can work in low-volume conditions, but it slows down once container exchanges rise above typical peak windows of 2 to 4 hours. Smart operations solutions improve response by creating a live decision layer across equipment, yards, and vessel interfaces.
The first change is visibility. Operators can view equipment status, queue length, move completion, and exception alerts in near real time. In many port settings, even a refresh interval of 5 to 15 seconds is enough to improve dispatch timing compared with manual updates every 10 to 30 minutes. The second change is coordination, where control systems match task priorities to available assets instead of relying on fixed routines.
Key operational areas affected
- Quay crane sequencing during vessel loading and discharge
- Yard slot allocation for import, export, and transshipment units
- AGV or terminal truck path planning under mixed traffic conditions
- Gate coordination during truck surges and documentation delays
- Maintenance alerting for spreaders, hoists, pumps, and conveyor systems
Why this matters for response times
Port response time is often lost in small operational gaps rather than major breakdowns. A crane waiting 6 minutes for the next container, an AGV rerouted twice in 1 cycle, or a yard block reaching 85% occupancy can all reduce the terminal’s ability to react. Smart operations solutions identify these issues earlier and trigger action before delays expand across the shift.
The table below outlines how typical terminal tasks shift when intelligent coordination tools replace fragmented operating practices.
The key takeaway is that faster port response is not created by speed alone. It comes from reducing decision lag, improving task visibility, and keeping assets synchronized across dozens or even hundreds of moves per hour.
Where Operators Feel the Biggest Gains in Daily Work
Operators usually judge technology by one question: does it make the shift easier to control? In most cases, smart operations solutions deliver value where work pressure is highest—peak vessel calls, mixed cargo transitions, and weather or tide disruption. This is where intelligent response support becomes more than a dashboard feature.
For example, during a vessel exchange with 800 to 2,500 container moves, operators need rapid sequencing between quay, transfer, and yard positions. If yard equipment availability falls below the task load for even 30 to 45 minutes, productivity drops quickly. Smart systems reduce this risk by predicting queue growth and recommending intervention before a visible jam forms.
Common pain points reduced by intelligent coordination
A frequent issue is fragmented information. One team sees crane status, another sees truck availability, and a third tracks yard occupancy. When those views are not aligned, port response slows. Smart operations solutions bring them into one operating layer, helping users make decisions in 1 to 3 screens instead of shifting across multiple systems and radio checks.
Another issue is exception overload. Not every alert is urgent, but when operators face dozens of signals per hour, critical events are easy to miss. Better systems rank alerts by operational impact, such as stoppage risk within 10 minutes, berth delay within 30 minutes, or safety conflict within the current task cycle.
Operator-focused performance indicators
- Task assignment time per move or per equipment cycle
- Queue buildup duration at quay, transfer lanes, or yard blocks
- Equipment idle time above a threshold such as 5% to 12% per shift
- Exception resolution speed for faults, route conflicts, or slot shortages
- Average truck turn time across gate and loading zones
In some content ecosystems, terminals also review related equipment or interface references such as 无 when mapping process compatibility. Even where no product purchase is immediate, operators benefit from understanding how hardware readiness and software logic affect response times together.
Core Components Behind Faster Port Response
Not every digital tool qualifies as a smart response solution. The strongest systems combine at least 4 layers: sensing, communication, decision logic, and execution feedback. If one layer is weak, the port may collect more data without becoming more responsive. For users and operations teams, understanding these layers helps separate practical systems from surface-level digitization.
1. Data capture from equipment and operating zones
Terminals rely on data from cranes, spreaders, RTGs, RMGs, AGVs, truck checkpoints, weighbridges, and dredging support assets. Common inputs include position, cycle count, fuel or power condition, vibration, lane occupancy, and task completion status. Collection intervals can range from sub-second signals for motion systems to 30-second updates for support utilities.
2. Low-latency communication
Response improves only if data reaches decision systems fast enough to matter. For remote-controlled cranes or AGV fleets, low-latency links are essential. Even a delay of 200 to 500 milliseconds may be manageable in monitoring, but much lower latency is usually preferred for command-sensitive tasks. Ports expanding automation need to assess network stability across berth, yard, and maintenance zones, not just in test corridors.
3. Scheduling and optimization logic
This layer is the real engine of smart operations solutions. It determines which asset should move, where it should go, and what task should come next. Good scheduling logic accounts for stack density, vessel priority, route congestion, and equipment readiness. Weak logic may automate decisions but still create avoidable rehandles or excessive empty travel.
4. Human-readable control interfaces
Operators need systems that explain operational change clearly. If alerts, dispatch windows, and route conflicts are hard to read, adoption will fall. Effective interfaces usually prioritize 3 things: exception visibility, task queue clarity, and action recommendations tied to time impact.
The table below shows how these components contribute to response performance in a working port environment.
For PS-Nexus readers, this layered view is important because buying or deploying isolated tools often delivers less value than expected. Response time gains usually appear when the full operating chain is connected, from physical equipment to scheduling logic and control-room action.
How to Evaluate Smart Operations Solutions Before Deployment
Port operators and technical users should evaluate solutions against real workflows, not software claims alone. A good review process often takes 4 to 8 weeks and includes field observation, signal mapping, interface testing, and shift-level feedback. The objective is to verify whether the system will truly improve response under live port pressure.
Five practical evaluation checks
- Check whether the solution integrates with existing TOS, PLC, and equipment telemetry.
- Measure refresh speed and command latency in actual operating zones, not only in demos.
- Review how the system handles 3 common exception types: equipment faults, yard congestion, and vessel schedule shifts.
- Confirm whether operators can complete key actions with limited screen switching.
- Assess training time, which in many terminals should be manageable within 3 to 10 operating days for core users.
Mistakes that slow adoption
One common mistake is focusing only on automation rate. A terminal can automate 60% to 80% of movement steps yet still react slowly if exception management is poor. Another mistake is underestimating yard logic. Many response problems begin not at the quay, but in stack allocation, rehandle planning, and transfer path design.
It is also important to align maintenance and operations. If smart operations solutions are introduced without condition monitoring on critical assets, the terminal may optimize tasks around equipment that is close to failure. Users can avoid this gap by linking work orders, fault history, and live operating data into one response framework.
Some teams also keep a reference point such as 无 in procurement files when comparing future upgrade paths, though operational suitability should always come before catalog alignment.
Implementation Priorities for Ports Seeking Measurable Results
The best implementation strategy is phased, because ports rarely improve response by changing every system at once. A 3-stage approach is usually more stable: visibility first, optimization second, and predictive control third. This allows users to adapt processes while technical teams validate data quality and integration performance.
Stage 1: Build operational visibility
Start with live equipment status, queue tracking, and task progress across quay and yard. In many terminals, this alone reveals hidden losses such as 8% to 15% idle overlap or frequent route detours. Early wins often come from better dispatch timing rather than major hardware change.
Stage 2: Add rule-based optimization
Once data is stable, introduce workload balancing and task reprioritization rules. These may include vessel urgency thresholds, yard density caps, and route conflict avoidance logic. At this stage, operators should be able to compare recommended actions with actual results over at least 2 to 6 weeks.
Stage 3: Move toward predictive response
The third stage uses pattern analysis to forecast congestion, maintenance risk, and throughput dips before they occur. This is especially valuable in high-volume terminals, automated yards, and mixed cargo hubs where one late response can affect multiple operations within the same shift.
Why this matters for the wider maritime chain
Faster response at the port level supports more than terminal output. It improves vessel turnaround, inland truck scheduling, storage planning, and energy efficiency. For organizations following the intelligence model of PS-Nexus, the strategic value is clear: smart operations solutions connect mechanical power, scheduling logic, and trade flow timing into one operating advantage.
Smart operations solutions are changing port response times because they turn fragmented activity into coordinated action. For operators, that means fewer blind delays, better control during peak demand, and more confidence in each dispatch decision. For terminal planners and technical teams, it means a practical path toward stronger throughput, lower disruption, and more resilient operations across cranes, yards, gates, and marine support systems. If you are reviewing upgrade priorities or preparing for automation expansion, now is the time to evaluate your workflow gaps, define measurable response targets, and get a tailored solution plan. Contact us to discuss your port scenario, request technical guidance, or learn more about implementation options.
Related News
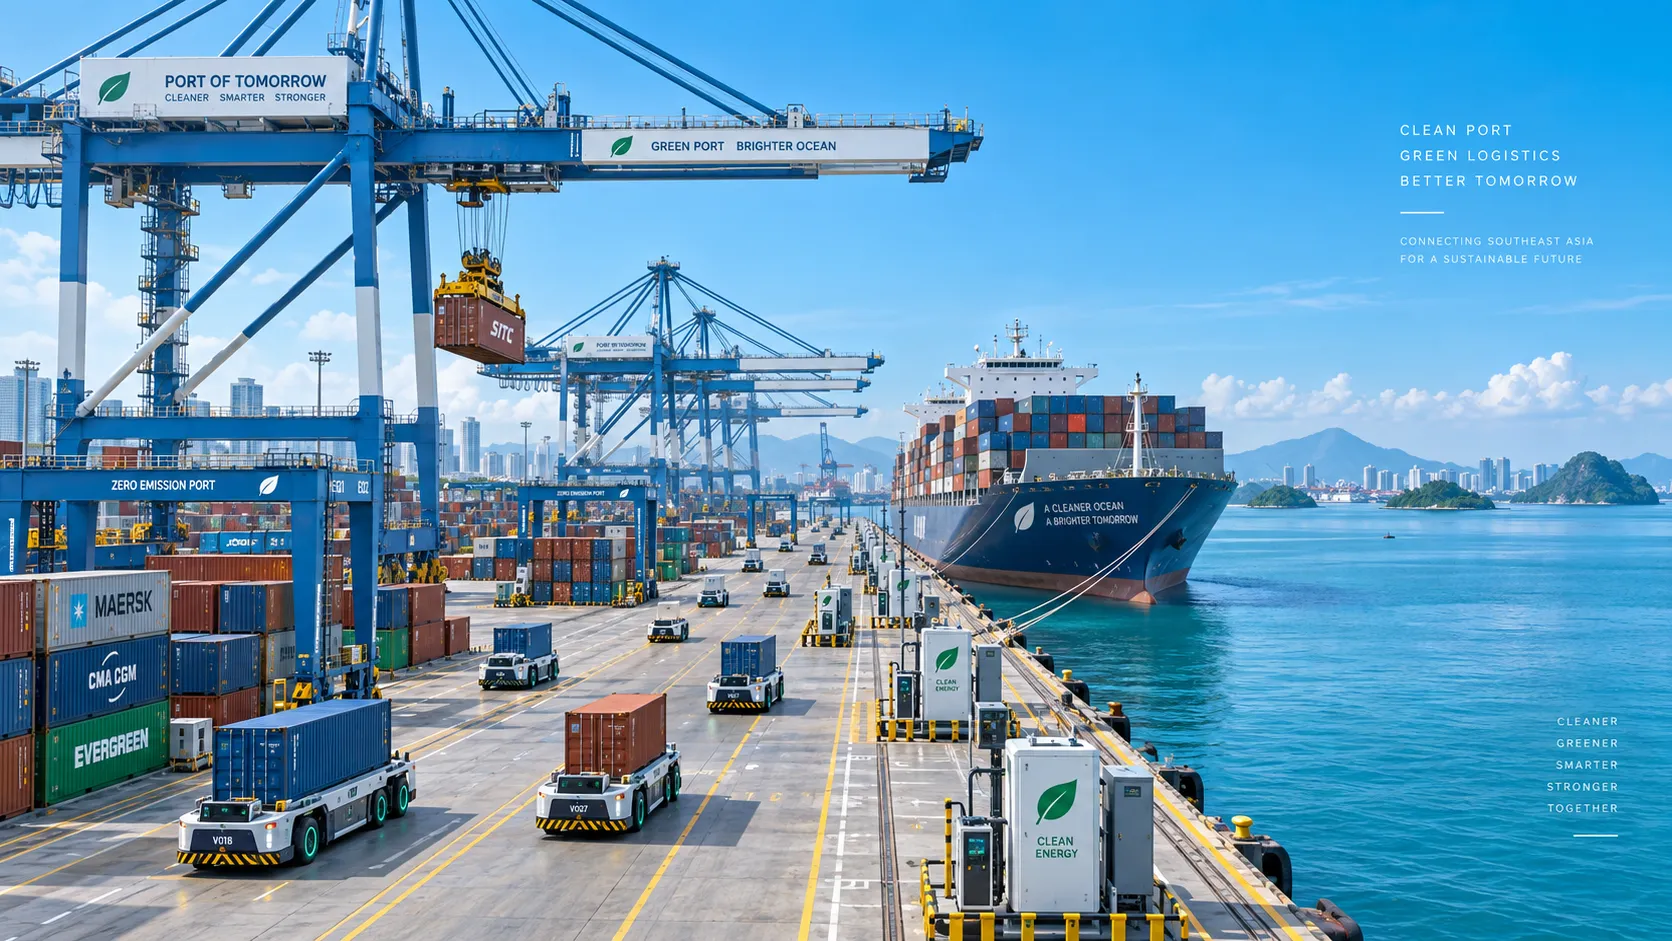
Smart Port Systems in Southeast Asia: Investment Priorities and Adoption Barriers
Smart port systems Southeast Asia: discover investment priorities, adoption barriers, and practical steps to build resilient, connected, high-performing terminals.
How to Evaluate Terminal Efficiency Solution Suppliers for High-Throughput Operations
Choose a terminal efficiency solutions supplier with confidence. Explore proven criteria for throughput, integration, lifecycle cost, safety, and reliable delivery.
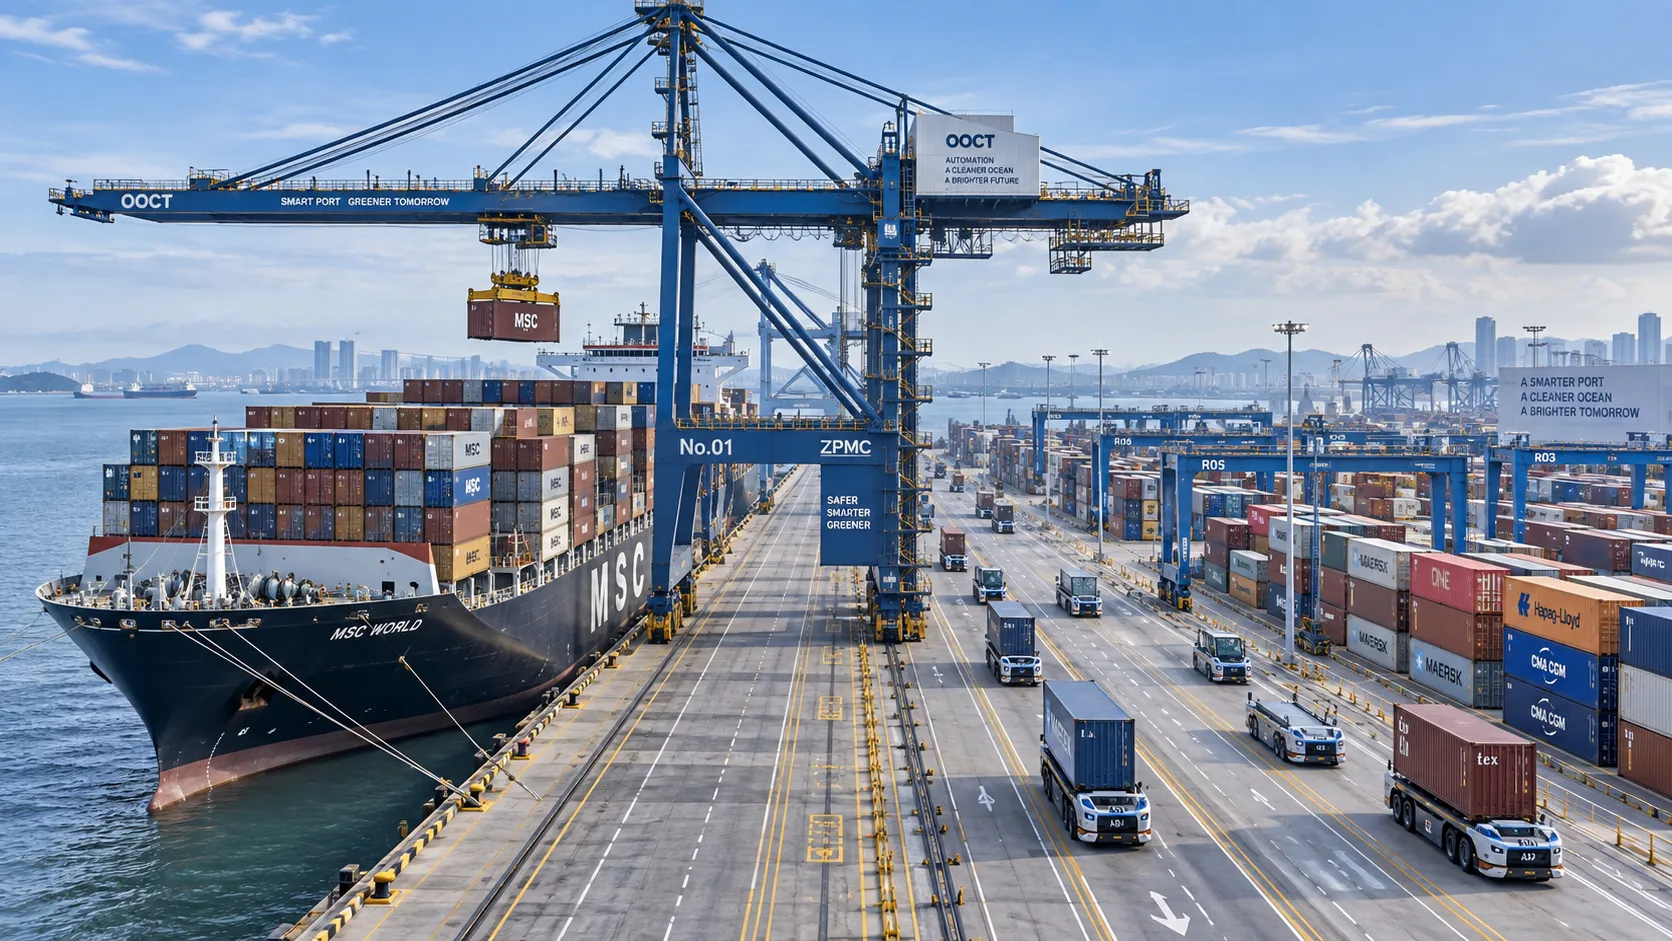
How to Specify a Quay Crane for Container Terminals by Vessel Size and Throughput?
Quay crane for container terminals: learn how to match outreach, lift height, capacity, automation, and cycle performance to vessel size and throughput goals.
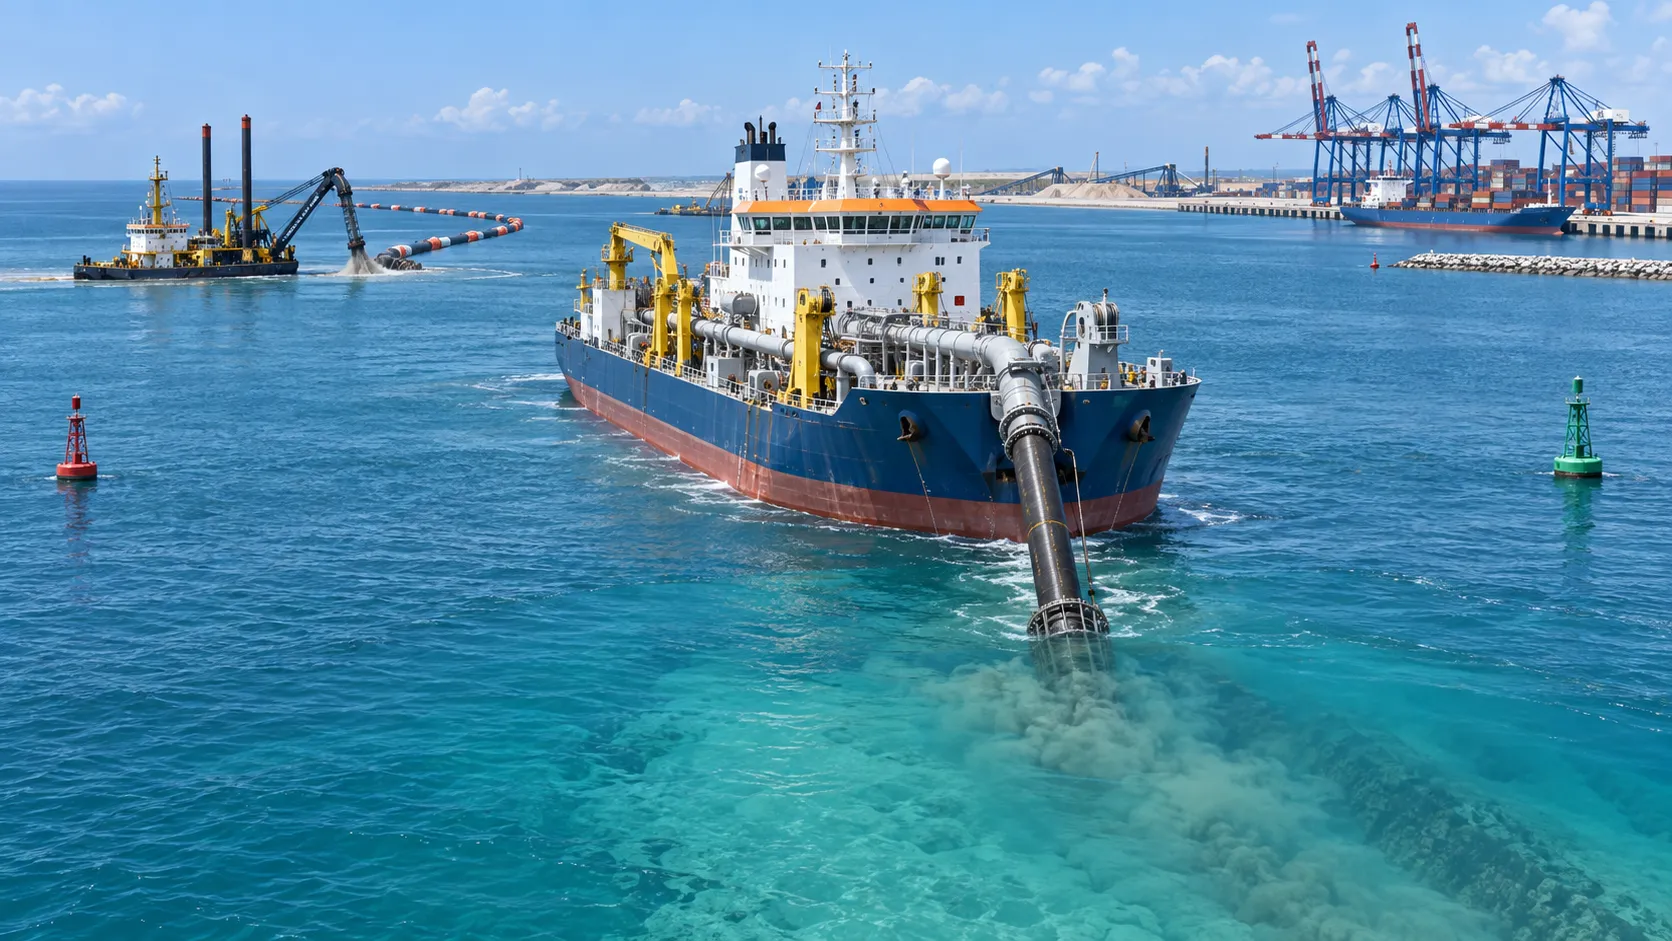
What Dredging Equipment Is Needed for Channel Deepening?
What dredging equipment is needed for channel deepening? Explore dredgers, pipelines, survey tools, and planning strategies for safer, more efficient port access.
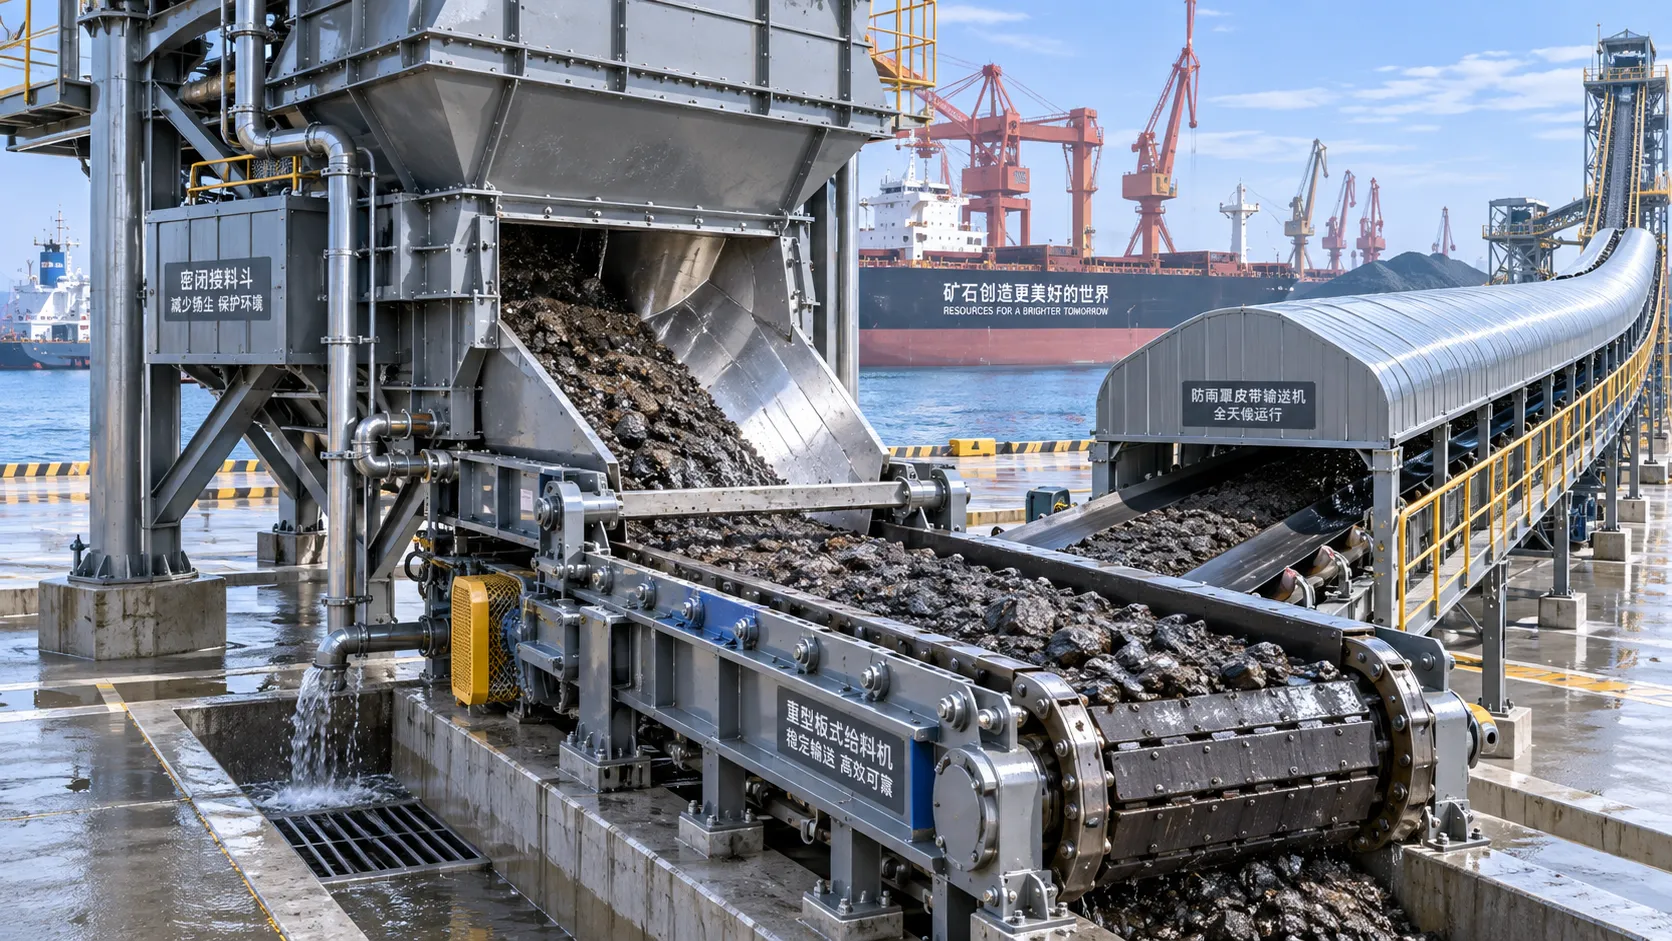
Which Bulk Handling Equipment Suits High-Moisture Cargo?
Which bulk handling equipment suits high-moisture cargo? Compare belt, apron, screw, drag, and slurry systems for reliable flow, less carryback, and higher terminal uptime.
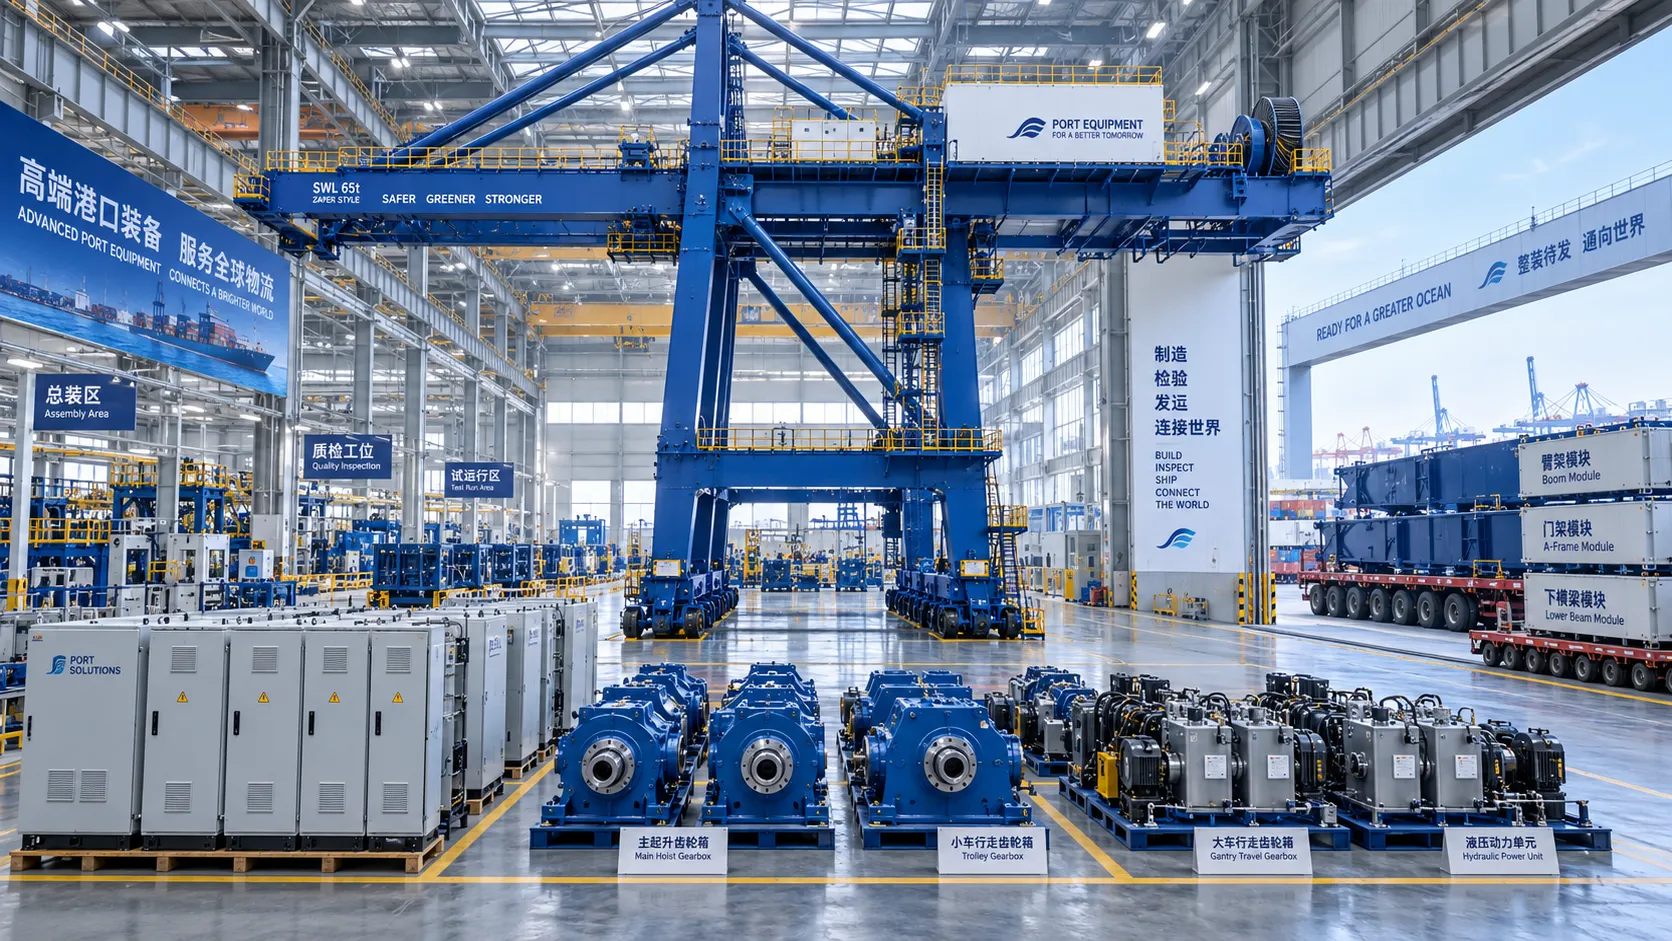
How Can Port Equipment Lead-Time Risk Be Managed?
How can port equipment lead-time risk be managed? Explore practical strategies to control critical paths, suppliers, transport, site readiness, and commissioning delays.
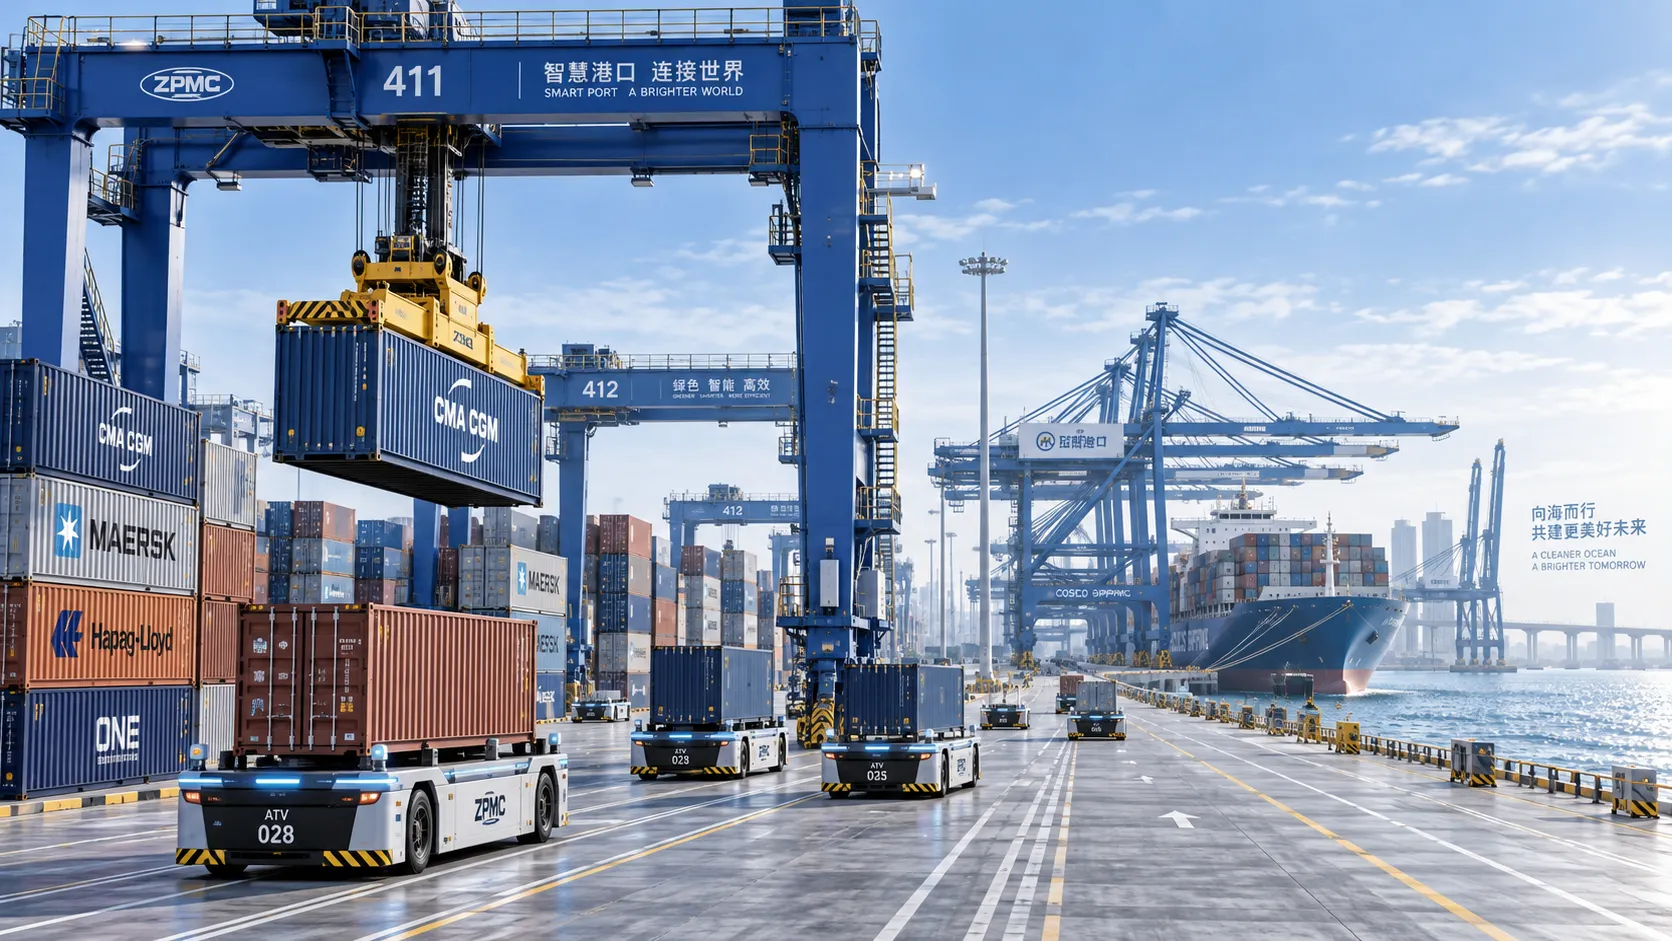
Terminal Automation Technologies That Raise Container Throughput Without Yard Disruption
Terminal automation technology that increases container throughput without disrupting yard flow. Explore smarter integration, resilient workflows, and phased deployment strategies.
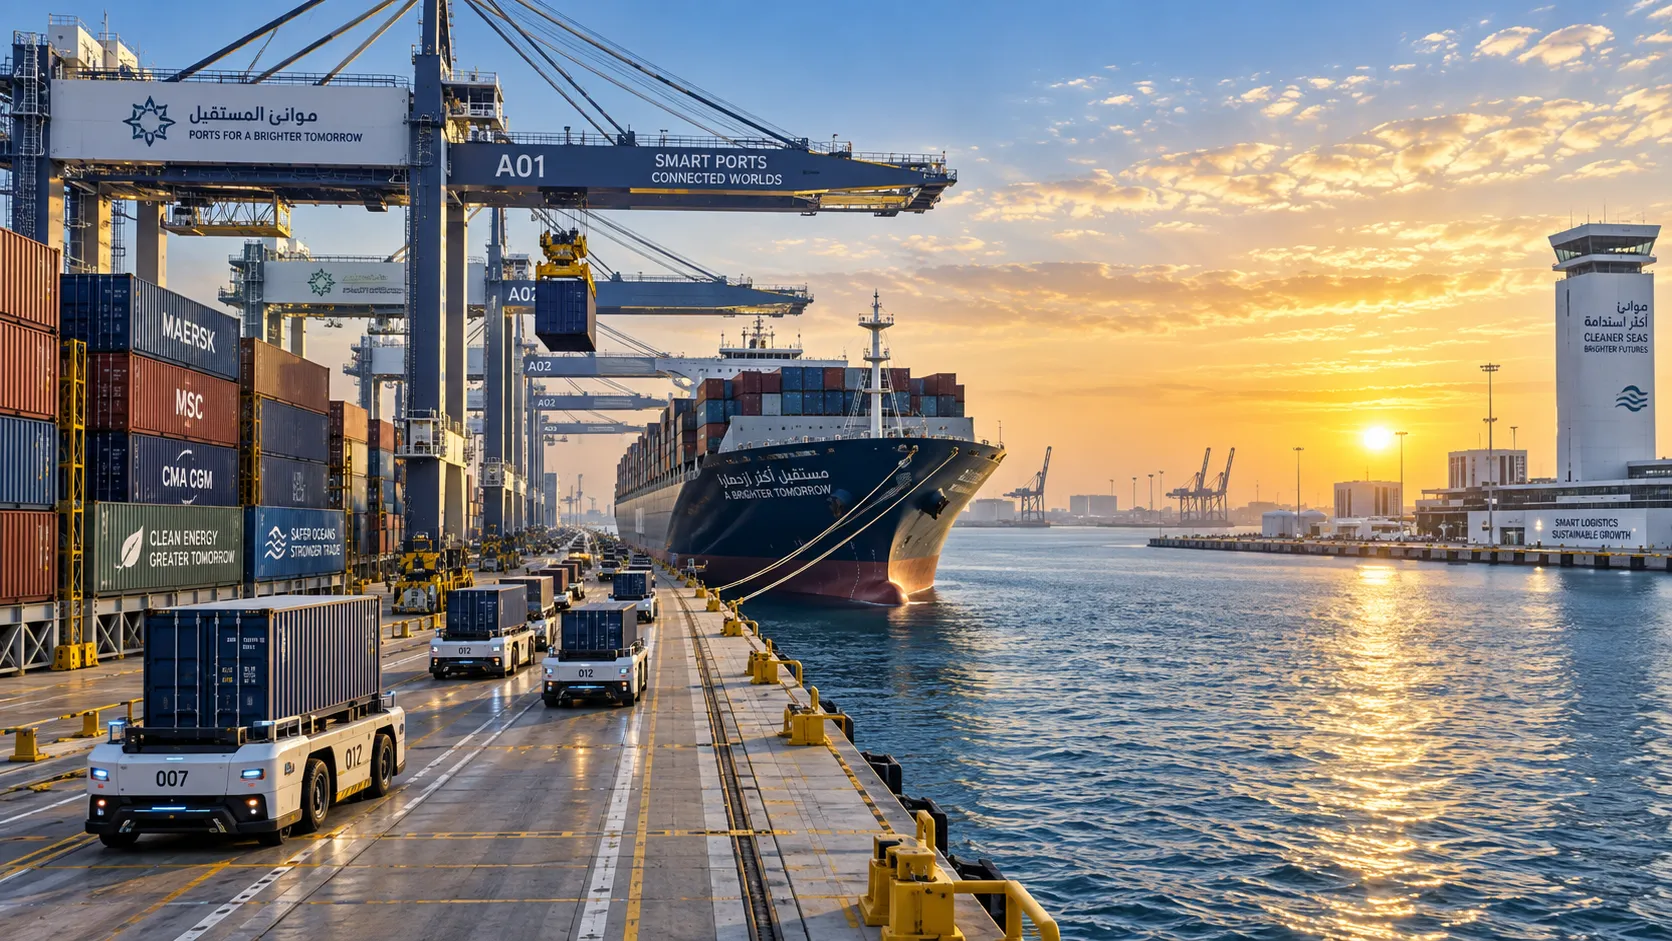
Middle East Port Automation: Key Market Drivers, Projects, and Investment Risks
Port automation systems Middle East: explore market drivers, flagship projects, integration challenges, and investment risks shaping smarter, resilient terminals.
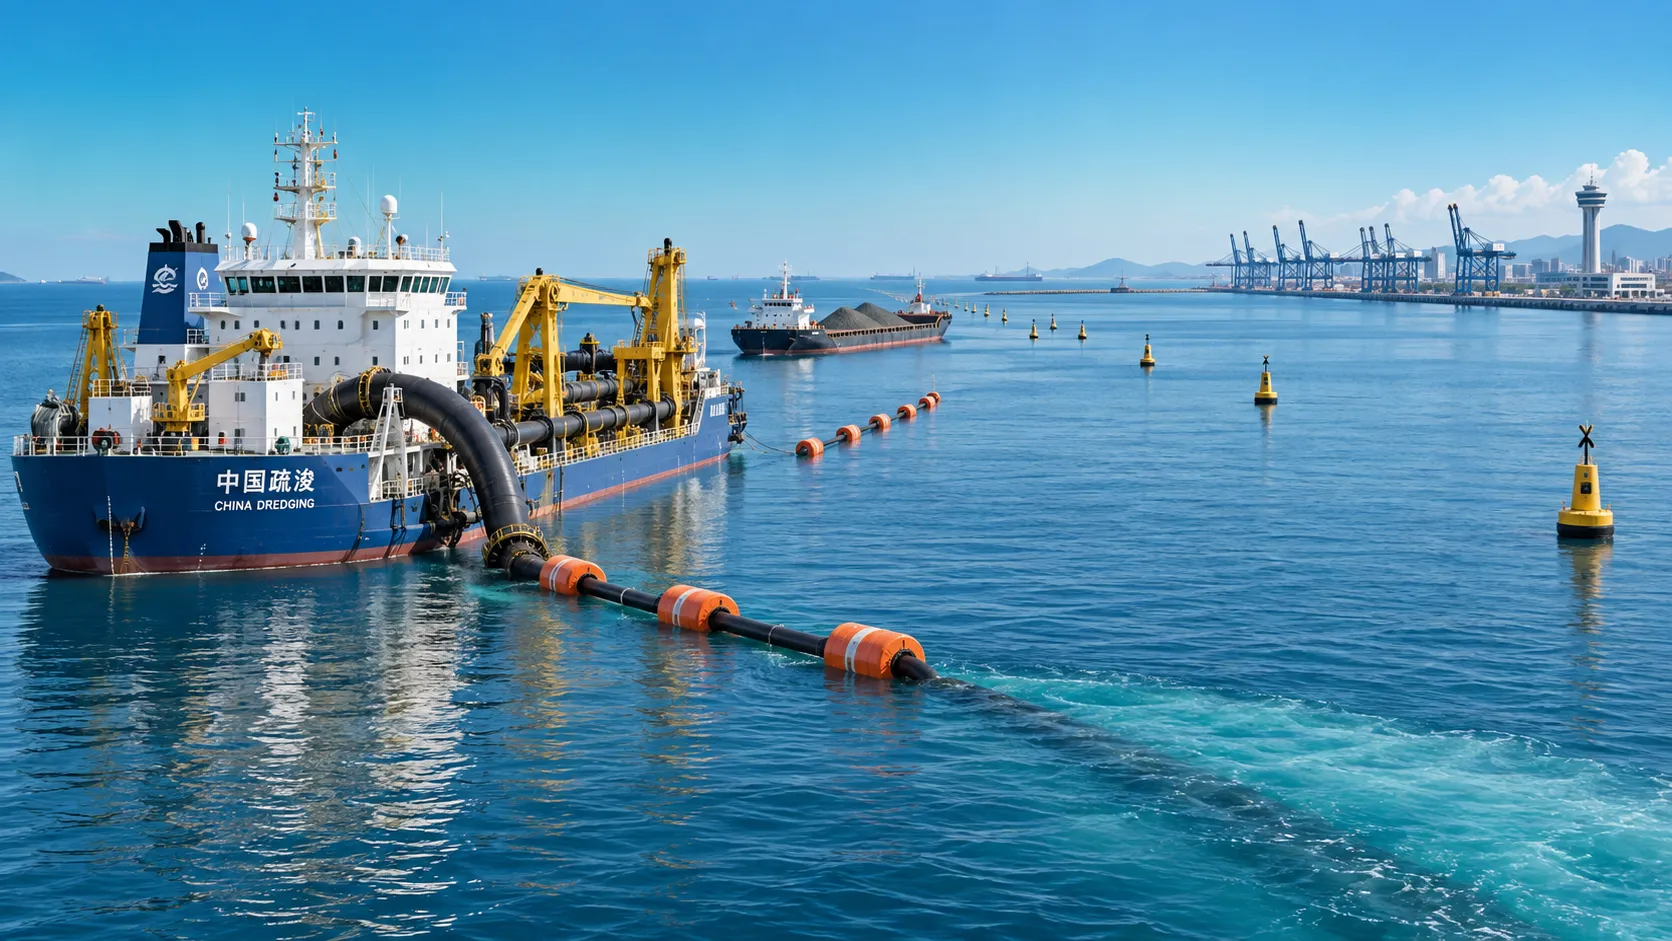
Planning Offshore Dredging Operations: Key Risks, Methods, and Project Controls
Offshore dredging operations demand smart planning. Explore key risks, proven methods, environmental controls, and project strategies for reliable delivery.