Related News
- 00
0000-00
Smart Port Systems Pricing: How to Compare Lifecycle Costs and ROI by Terminal Scale - 00
0000-00
What Drives Bulk Material Handling Pricing in Large Conveyor System Projects? - 00
0000-00
How Shipping Rate Analytics in Europe Help Importers Predict Costs and Route Risk - 00
0000-00
What Buyers Check When Reviewing Used PVC Coating Line Output and Condition - 00
0000-00
Automated Port Systems Cost Breakdown: CAPEX, Integration, and Maintenance Factors
Port automation is reshaping terminal cost control
Port automation is no longer just an operational upgrade; it is becoming a decisive lever for terminal cost control. For finance approvers evaluating capital allocation, the question is shifting from “Can we afford automation?” to “How much margin risk do we carry without it?” From automated container handling and AI-driven yard scheduling to remote crane control and predictive maintenance, modern systems can reduce labor volatility, equipment downtime, energy waste, and berth delays—turning complex terminal operations into measurable financial performance.
For CFOs, investment committees, and procurement boards, port automation must be assessed through financial exposure, asset productivity, and long-cycle infrastructure value. A terminal is not a single machine purchase; it is a 10–25 year operating platform where minutes, moves, energy curves, and maintenance windows compound into margin.
Why terminal cost control now depends on port automation
Manual and semi-automated terminals often hide cost leakage inside operational variability. A 5-minute crane delay, 2 extra rehandles per container, or a 4-hour equipment outage may appear local, but finance teams see the impact through overtime, penalties, fuel use, and lost berth capacity.
Port automation converts this variability into controllable data points. Automated stacking cranes, terminal operating systems, AGV dispatching, OCR gates, and equipment health monitoring create a measurable chain from vessel arrival to yard release.
The finance view: cost pools affected by automation
Finance approvers should avoid evaluating port automation only as a capex line. The stronger approach is to map each automation layer to 6 major cost pools: labor, energy, maintenance, yard utilization, vessel turnaround, and risk cost.
The table below outlines practical cost-control links that are commonly used during terminal automation feasibility reviews, vendor comparison, and board-level business case preparation.
The key conclusion is that port automation changes the cost conversation from “headcount replacement” to “variance compression.” For financial leaders, lower variance improves forecast reliability, debt-service confidence, and tariff negotiation quality.
Where margin leakage usually begins
- Berth delays caused by inconsistent crane productivity during peak vessel calls.
- Excess yard rehandling when container positions are planned by static rules instead of live demand.
- Maintenance overruns when critical gear is inspected by calendar rather than condition data.
- Energy spikes from long travel paths, engine idling, and poor equipment synchronization.
Even modest inefficiencies matter at scale. A terminal handling 800,000 to 2 million TEU annually can turn small operational gaps into material annual cost exposure, especially when labor markets, fuel prices, and carrier schedules remain unstable.
Building a bankable business case for port automation
A bankable port automation proposal should combine engineering logic with finance language. The investment case must explain scope, baseline performance, improvement assumptions, implementation risk, and post-commissioning governance in a format suitable for approval cycles.
Most terminal automation projects are reviewed across 3 horizons: quick digital controls within 6–12 months, equipment automation over 12–36 months, and integrated unmanned operations over 3–5 years.
A practical 5-step evaluation framework
- Define the operating baseline: moves per hour, downtime, energy use, yard density, and maintenance backlog.
- Segment automation scope: quay cranes, yard cranes, AGVs, gates, control room, and maintenance systems.
- Quantify value pools: labor stability, berth productivity, energy reduction, asset availability, and safety exposure.
- Stress-test assumptions: peak season, system outage, cyber event, integration delay, and ramp-up productivity.
- Set governance: milestone payments, acceptance criteria, operator training, and 90-day stabilization reviews.
The strongest business cases use ranges rather than single-point promises. A credible model may test 3 scenarios: conservative, expected, and accelerated, with assumptions clearly linked to operational levers.
Capex is visible, but avoided cost is strategic
Finance teams naturally examine procurement price, integration expense, civil works, software licensing, and lifecycle service fees. However, the missed-cost side is often larger than the purchase invoice over 10 years.
Port automation can reduce reliance on last-minute labor allocation, lower unplanned maintenance, and improve equipment sequencing. These gains protect operating margin during high-volume surges and low-volume downturns.
Metrics finance approvers should request
- Cost per container move before and after automation, separated by labor, energy, and maintenance.
- Planned versus unplanned downtime, with a target review interval of 30, 60, and 90 days after go-live.
- Crane productivity variance across shifts, vessel types, weather windows, and peak operating days.
- Energy intensity per move, including electrified equipment demand and charging schedule stability.
PS-Nexus recommends that approval teams align these metrics with contract clauses. Acceptance should not rely only on equipment delivery; it should measure system behavior under realistic terminal operating conditions.
Choosing the right automation layers for terminal economics
Not every terminal needs a fully unmanned yard on day one. The correct port automation roadmap depends on throughput, land constraints, labor availability, energy policy, vessel mix, and existing terminal operating system maturity.
A finance approver should ask whether each layer solves a measurable constraint. The best sequence often starts where 20% of operational friction drives 80% of cost instability.
Automation options and decision triggers
The table below compares common port automation layers from a procurement and cost-control perspective. It is designed for early screening before a detailed technical tender or vendor dialogue.
This comparison shows why automation sequencing matters. A predictive maintenance system may create faster value in a mixed-equipment terminal, while automated stacking cranes may dominate where yard land costs are the financial bottleneck.
Selection standards that reduce procurement risk
- Require open integration with existing TOS, gate systems, OCR, maintenance software, and enterprise reporting tools.
- Request cybersecurity provisions covering access control, backup operations, incident response, and network segmentation.
- Set measurable acceptance criteria, such as availability thresholds, response time, error rate, and alarm resolution process.
- Assess lifecycle support over 5–10 years, including software updates, spare parts, training, and remote diagnostics.
For board approval, these standards are not technical details; they are financial protections. Poor integration can delay payback by several quarters, while weak service design can shift savings into emergency support costs.
Implementation risks finance teams should challenge early
Port automation projects fail financially when implementation assumptions are too optimistic. The most common gaps are underestimated interface work, insufficient operator retraining, unclear safety zoning, and weak change management.
A realistic deployment plan includes pilot testing, parallel operations, phased cutover, and contingency procedures. Many terminals require 2–4 commissioning waves rather than one large operational switch.
Risk questions for approval committees
- What happens if the automation system underperforms by 10% during the first operating quarter?
- Which operations can continue manually during a control system interruption?
- How many operators, technicians, and planners must be trained before live deployment?
- What are the contractual remedies for missed interface milestones or unavailable spare parts?
- How will project governance track benefits after acceptance, not just before contract award?
These questions help convert port automation from a technology purchase into a controlled transformation program. They also reveal whether a vendor understands terminal economics or only equipment specifications.
Training, safety, and operational continuity
Remote operation and automated container handling change job design. Finance teams should budget for simulation training, revised standard operating procedures, safety validation, and 24/7 support during stabilization.
A practical training plan may include 40–80 hours for remote crane operators, 2–3 weeks for maintenance technicians, and repeated shift drills for exception handling during vessel peaks.
Financial controls during rollout
- Use milestone payments tied to factory testing, site integration, operational trial, and final performance acceptance.
- Reserve contingency for civil adjustments, communication upgrades, sensor calibration, and operational downtime windows.
- Create a benefit-tracking dashboard reviewed weekly during ramp-up and monthly after stabilization.
The most resilient projects treat the first 90 days as a managed performance period. This protects both terminal throughput and the credibility of future automation funding requests.
How PS-Nexus supports smarter automation decisions
The Global Port-Sync Hub, known as PS-Nexus, connects heavy terminal gear, automated container handling, and marine engineering intelligence for decision-makers in maritime logistics and coastal economics.
For finance approvers, PS-Nexus is valuable because it links equipment performance, algorithmic scheduling, dredging capacity, and global trade patterns into practical commercial intelligence.
Intelligence areas relevant to capital allocation
- Mega port terminal gear analysis for quay productivity, lifting capacity, and throughput bottlenecks.
- Bulk handling machinery insights for high-volume energy, minerals, grain, and raw material terminals.
- Specialized container handling coverage for yard mobility, reach, stacking density, and fleet flexibility.
- Port automation and control systems intelligence for unmanned terminals, AGVs, and crane command logic.
- Dredging engineering equipment analysis for fairway expansion, berth access, and coastal infrastructure growth.
This cross-domain view matters because terminal cost control rarely depends on one machine. A bottleneck may sit in berth depth, yard congestion, crane scheduling, gate flow, or maintenance discipline.
From technical signals to board-ready insight
PS-Nexus focuses on low-latency communication protocols, AGV path planning, digital pump monitoring, and commercial demand patterns. These topics help approval teams judge whether proposed systems are timely, scalable, and financially defensible.
Instead of treating port automation as an isolated vendor pitch, finance leaders can compare technology maturity, operational fit, and market timing before committing budget to a long-cycle infrastructure program.
Turning automation into measurable terminal value
Port automation is reshaping terminal cost control by making operations more predictable, assets more visible, and financial performance easier to govern. The value is strongest when automation scope is tied to measurable constraints.
For finance approvers, the decision should balance capex, payback timing, lifecycle service, operational resilience, and strategic trade positioning. A well-planned automation roadmap can support cost discipline, net-zero ambitions, and stronger terminal competitiveness.
If your team is evaluating automated container handling, remote crane control, AGV deployment, or predictive maintenance economics, PS-Nexus can help structure the intelligence needed for a clearer approval path. Contact us to explore tailored insights, compare solution directions, and learn more about automation strategies for modern port terminals.
Related News
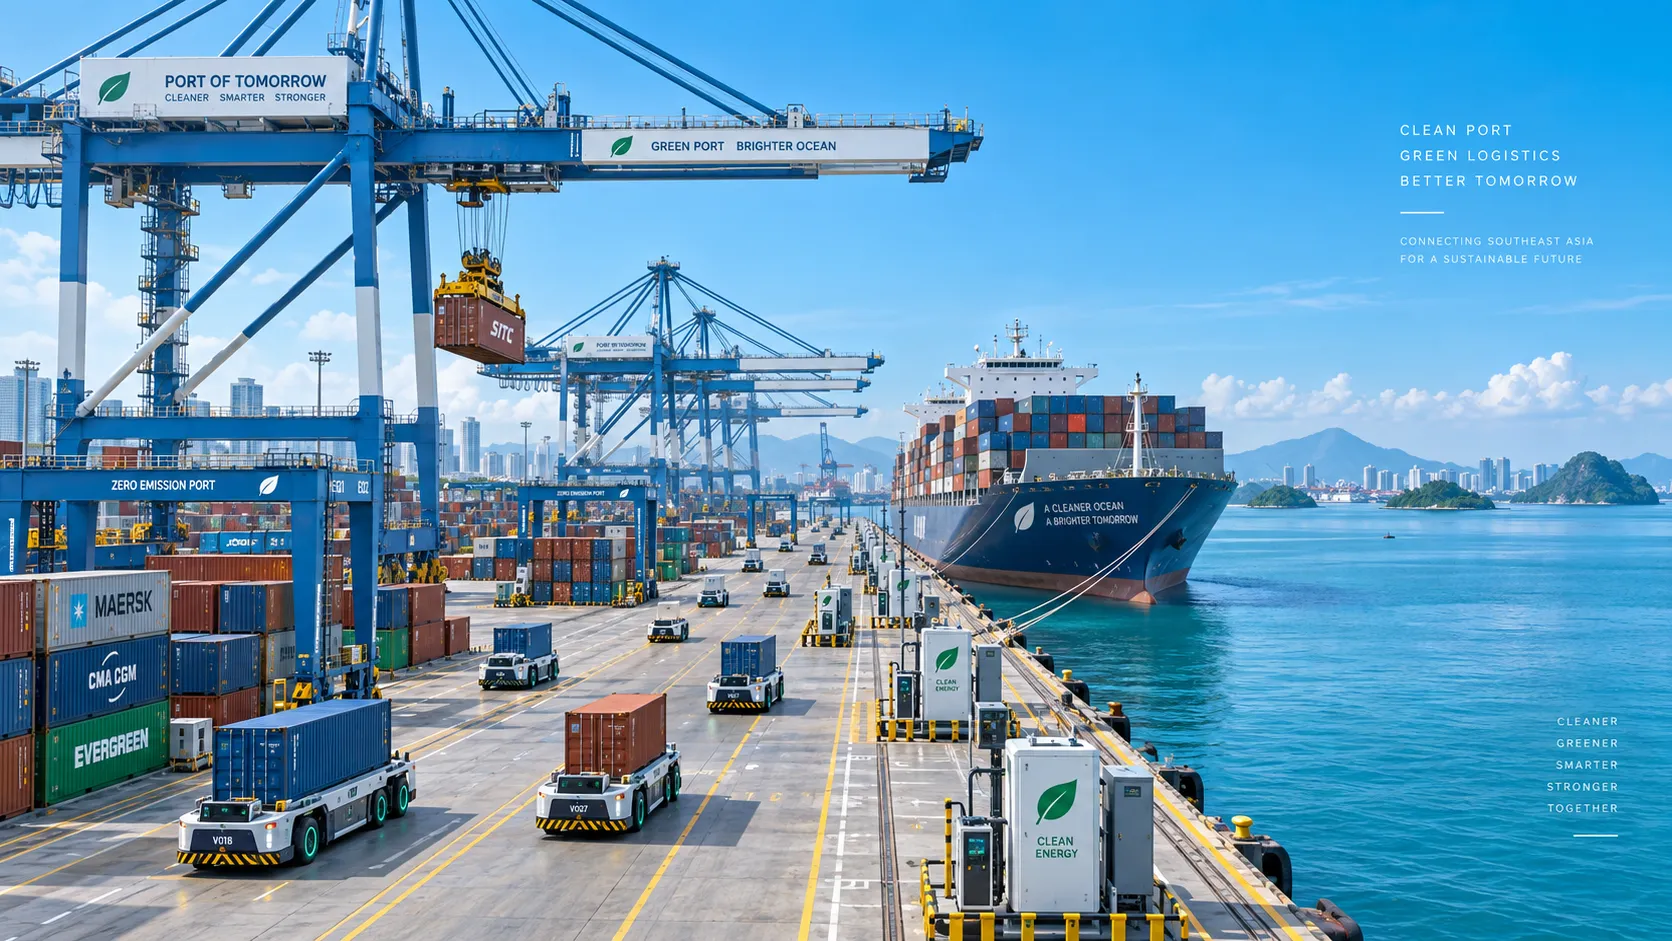
Smart Port Systems in Southeast Asia: Investment Priorities and Adoption Barriers
Smart port systems Southeast Asia: discover investment priorities, adoption barriers, and practical steps to build resilient, connected, high-performing terminals.
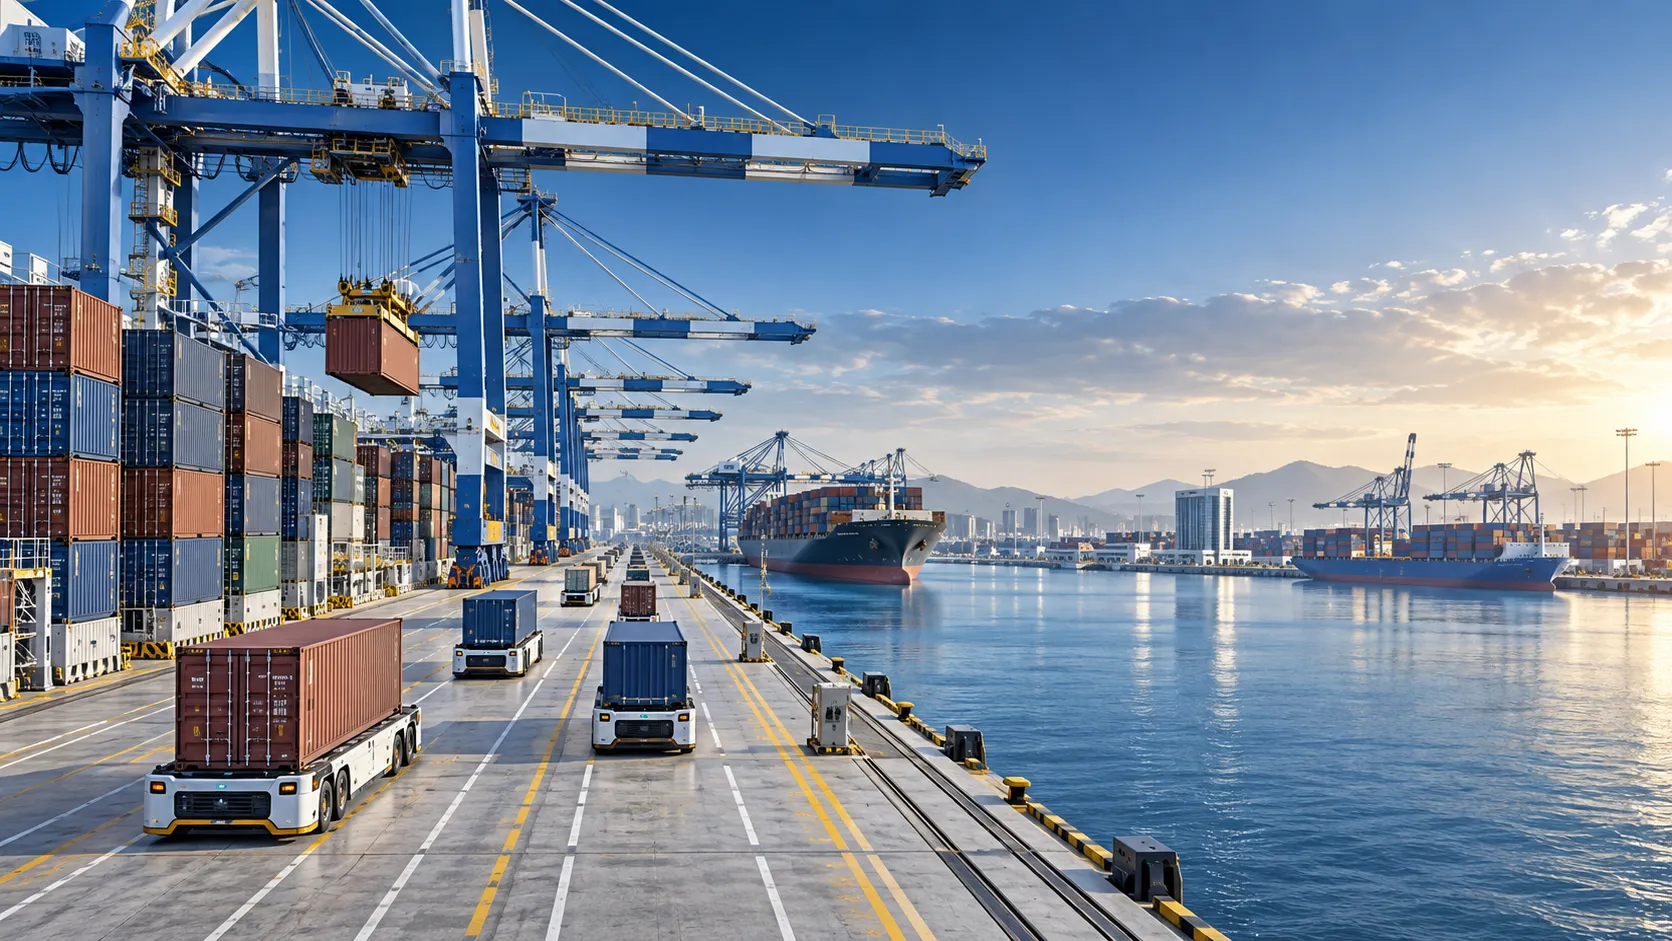
How to Evaluate Terminal Efficiency Solution Suppliers for High-Throughput Operations
Choose a terminal efficiency solutions supplier with confidence. Explore proven criteria for throughput, integration, lifecycle cost, safety, and reliable delivery.
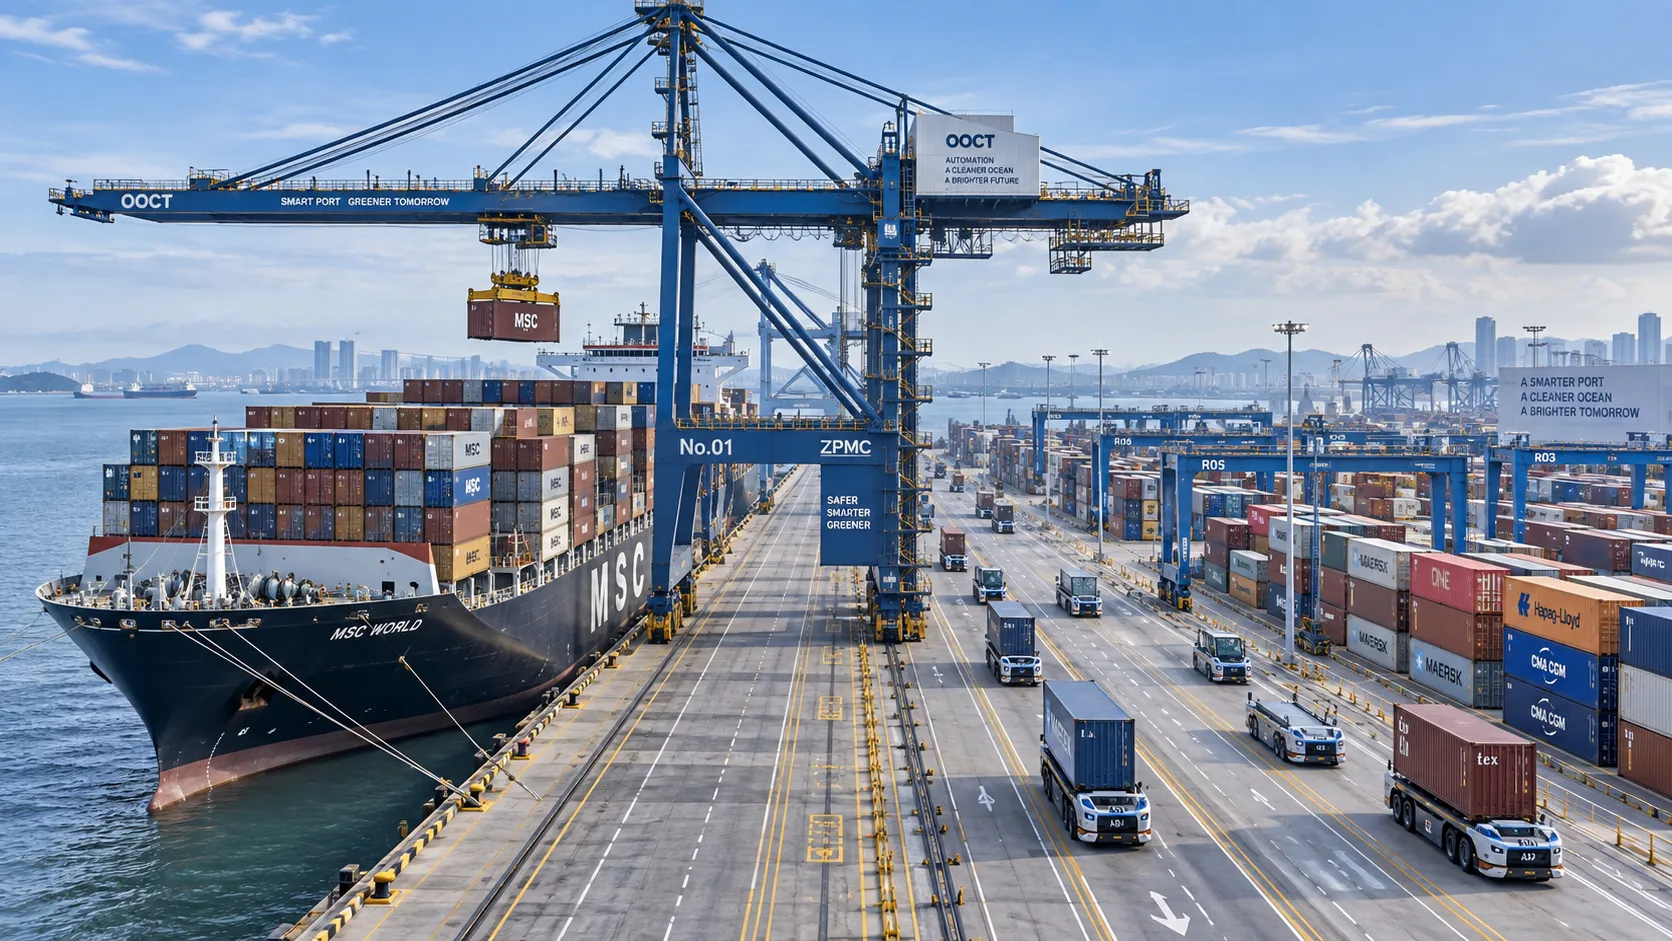
How to Specify a Quay Crane for Container Terminals by Vessel Size and Throughput?
Quay crane for container terminals: learn how to match outreach, lift height, capacity, automation, and cycle performance to vessel size and throughput goals.
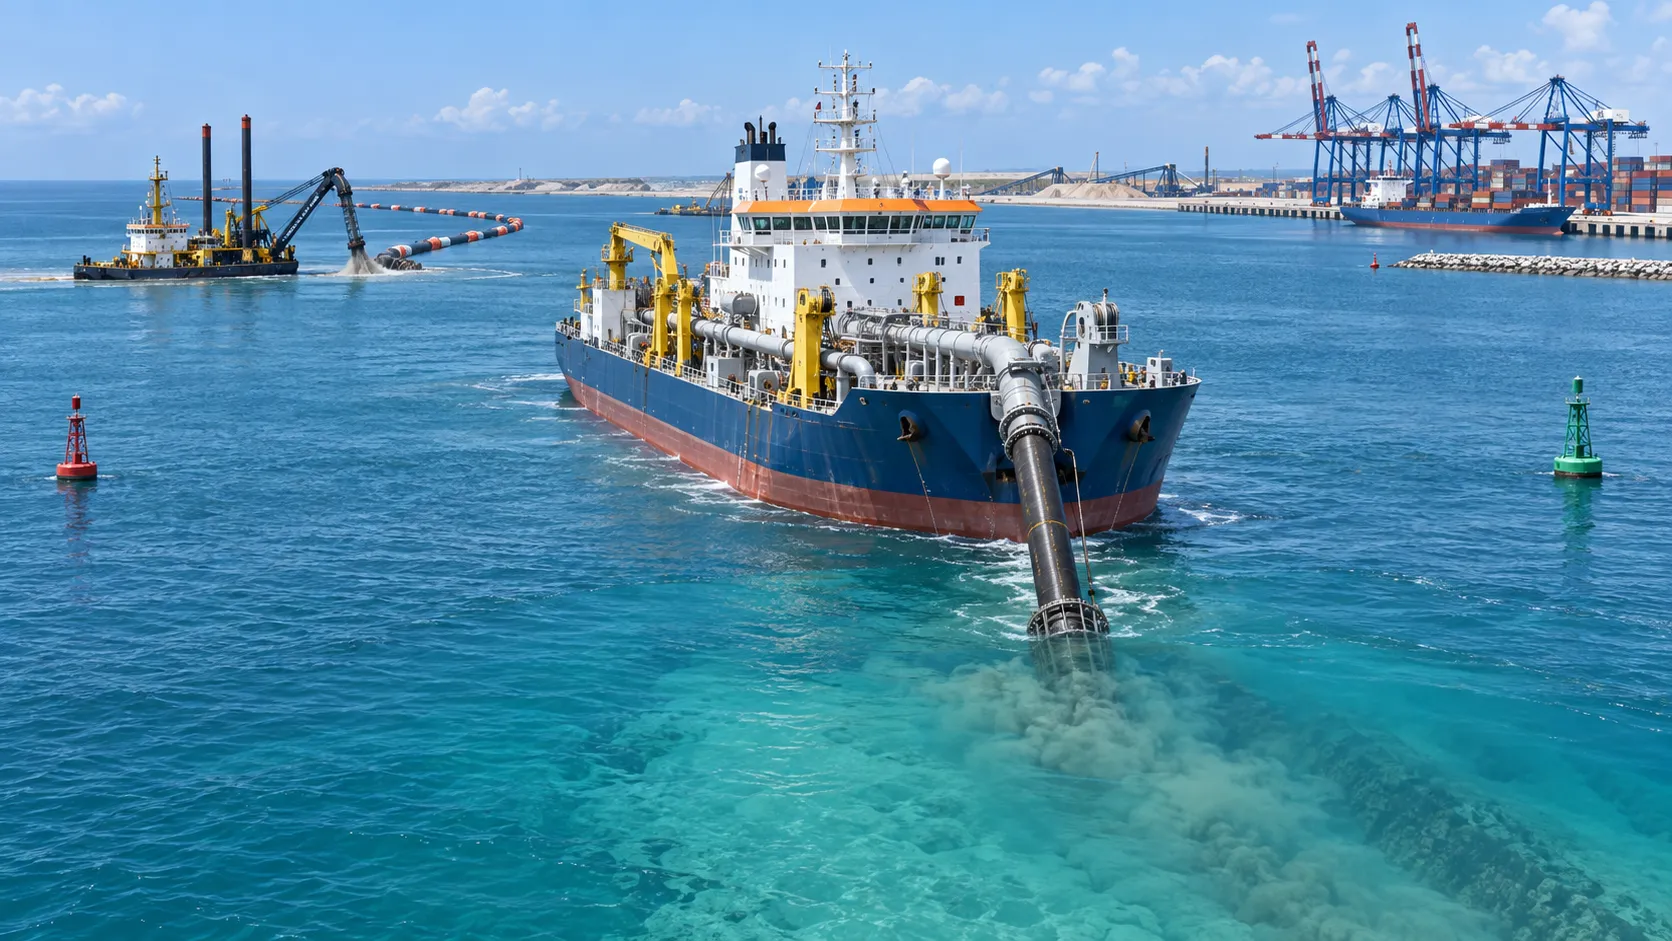
What Dredging Equipment Is Needed for Channel Deepening?
What dredging equipment is needed for channel deepening? Explore dredgers, pipelines, survey tools, and planning strategies for safer, more efficient port access.
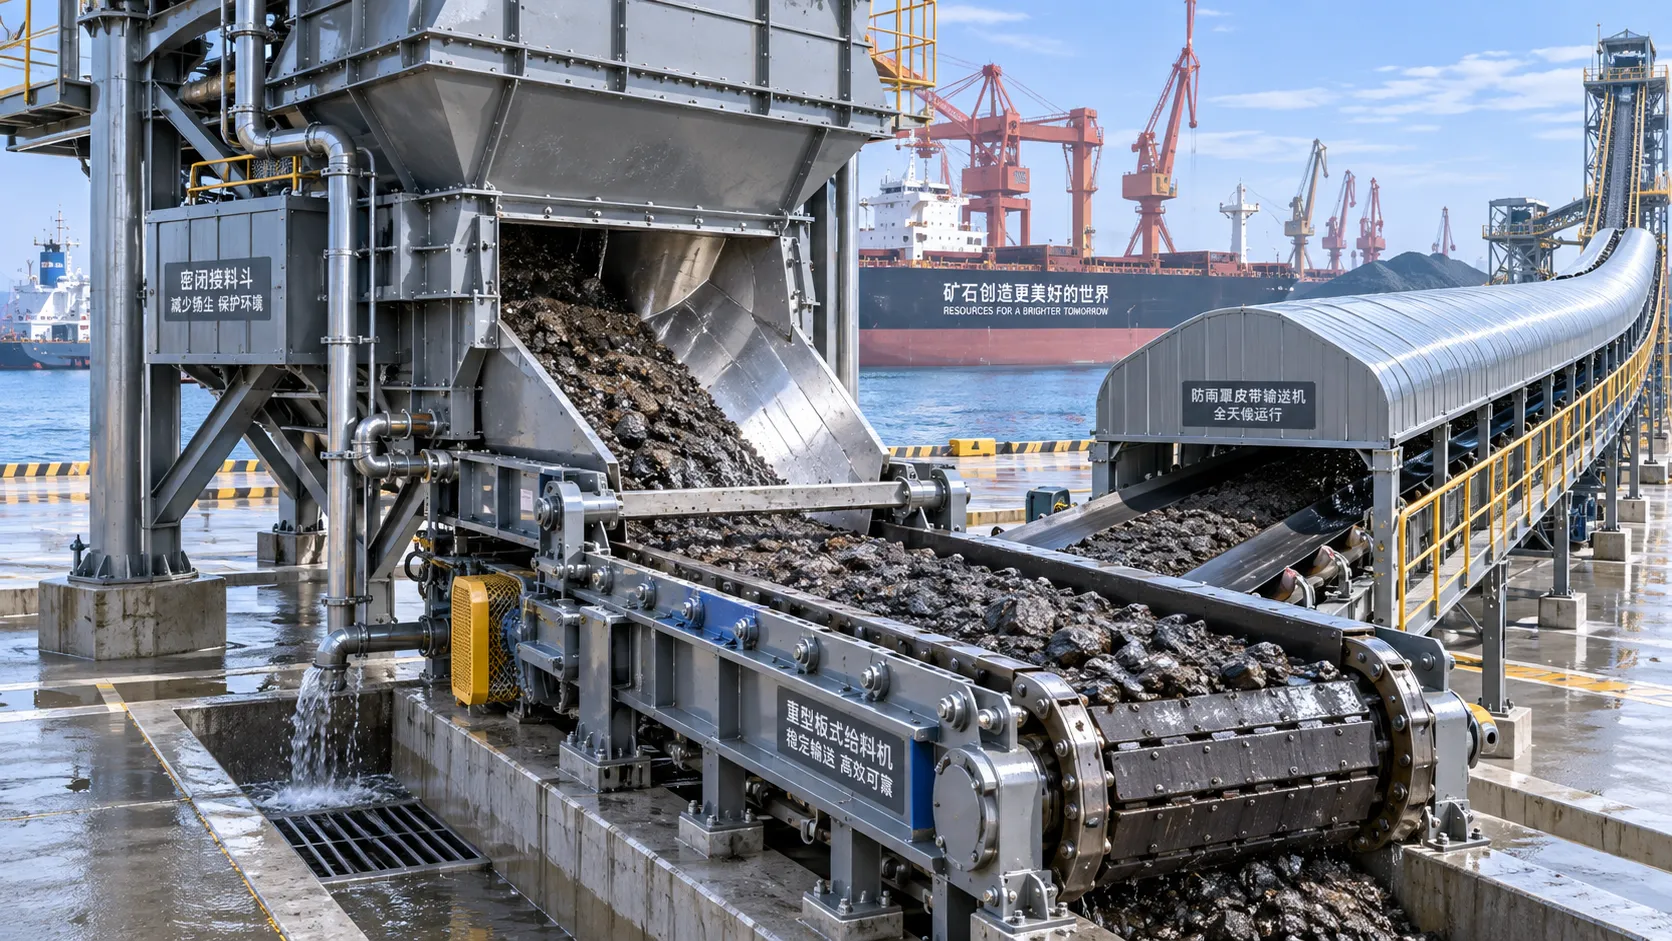
Which Bulk Handling Equipment Suits High-Moisture Cargo?
Which bulk handling equipment suits high-moisture cargo? Compare belt, apron, screw, drag, and slurry systems for reliable flow, less carryback, and higher terminal uptime.
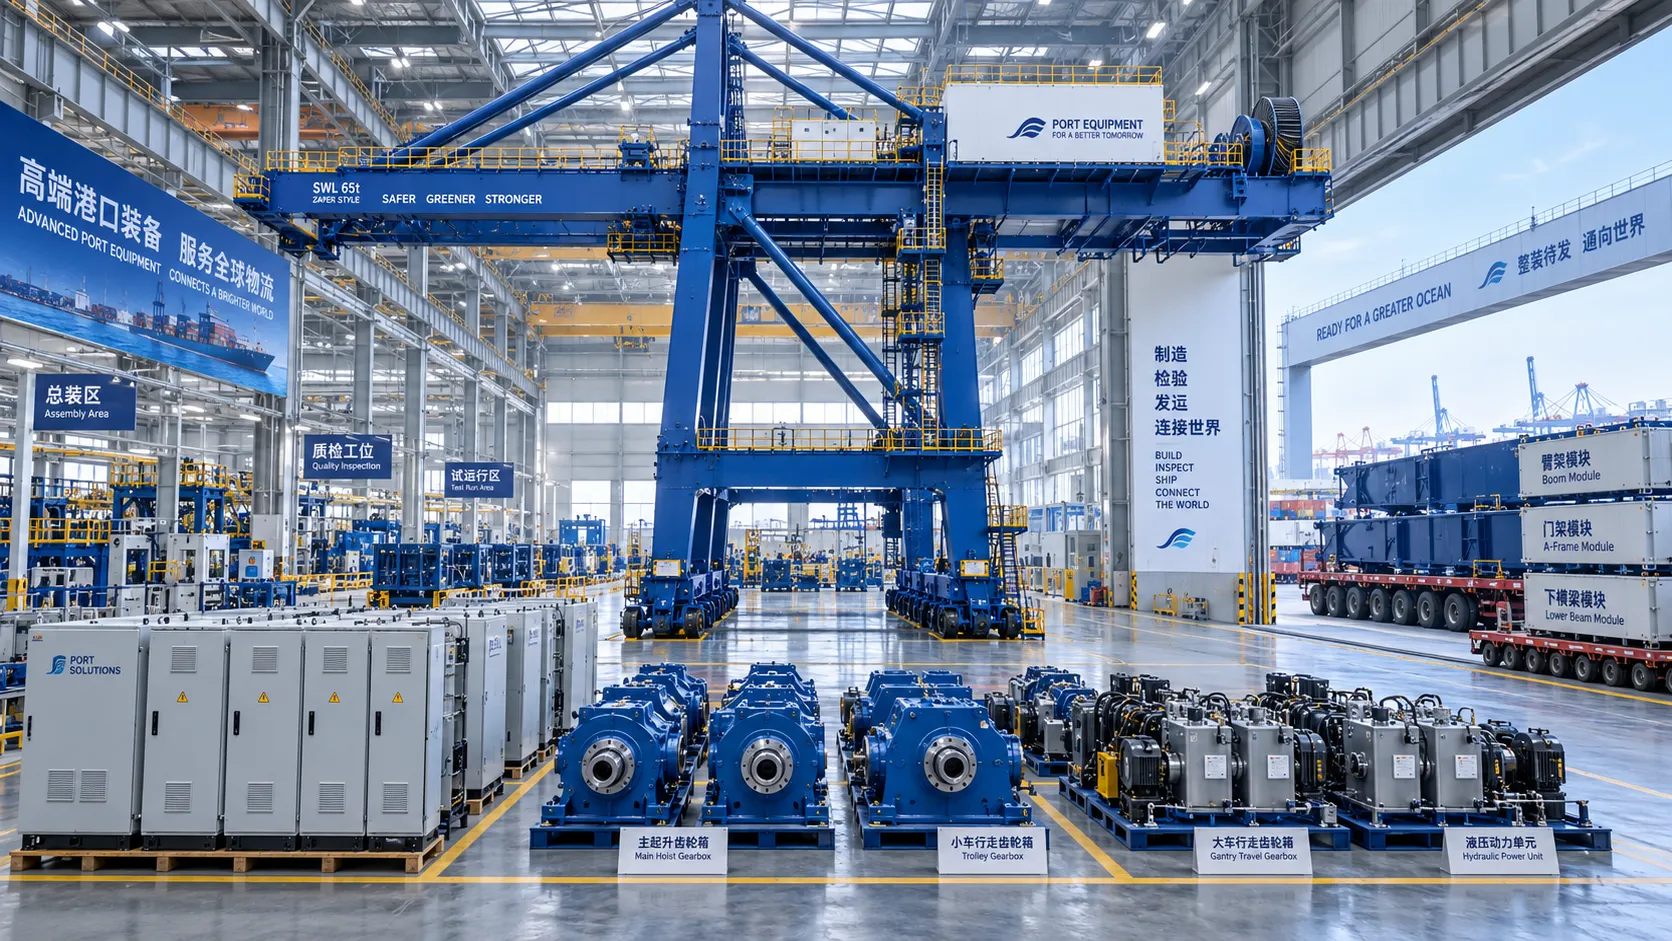
How Can Port Equipment Lead-Time Risk Be Managed?
How can port equipment lead-time risk be managed? Explore practical strategies to control critical paths, suppliers, transport, site readiness, and commissioning delays.
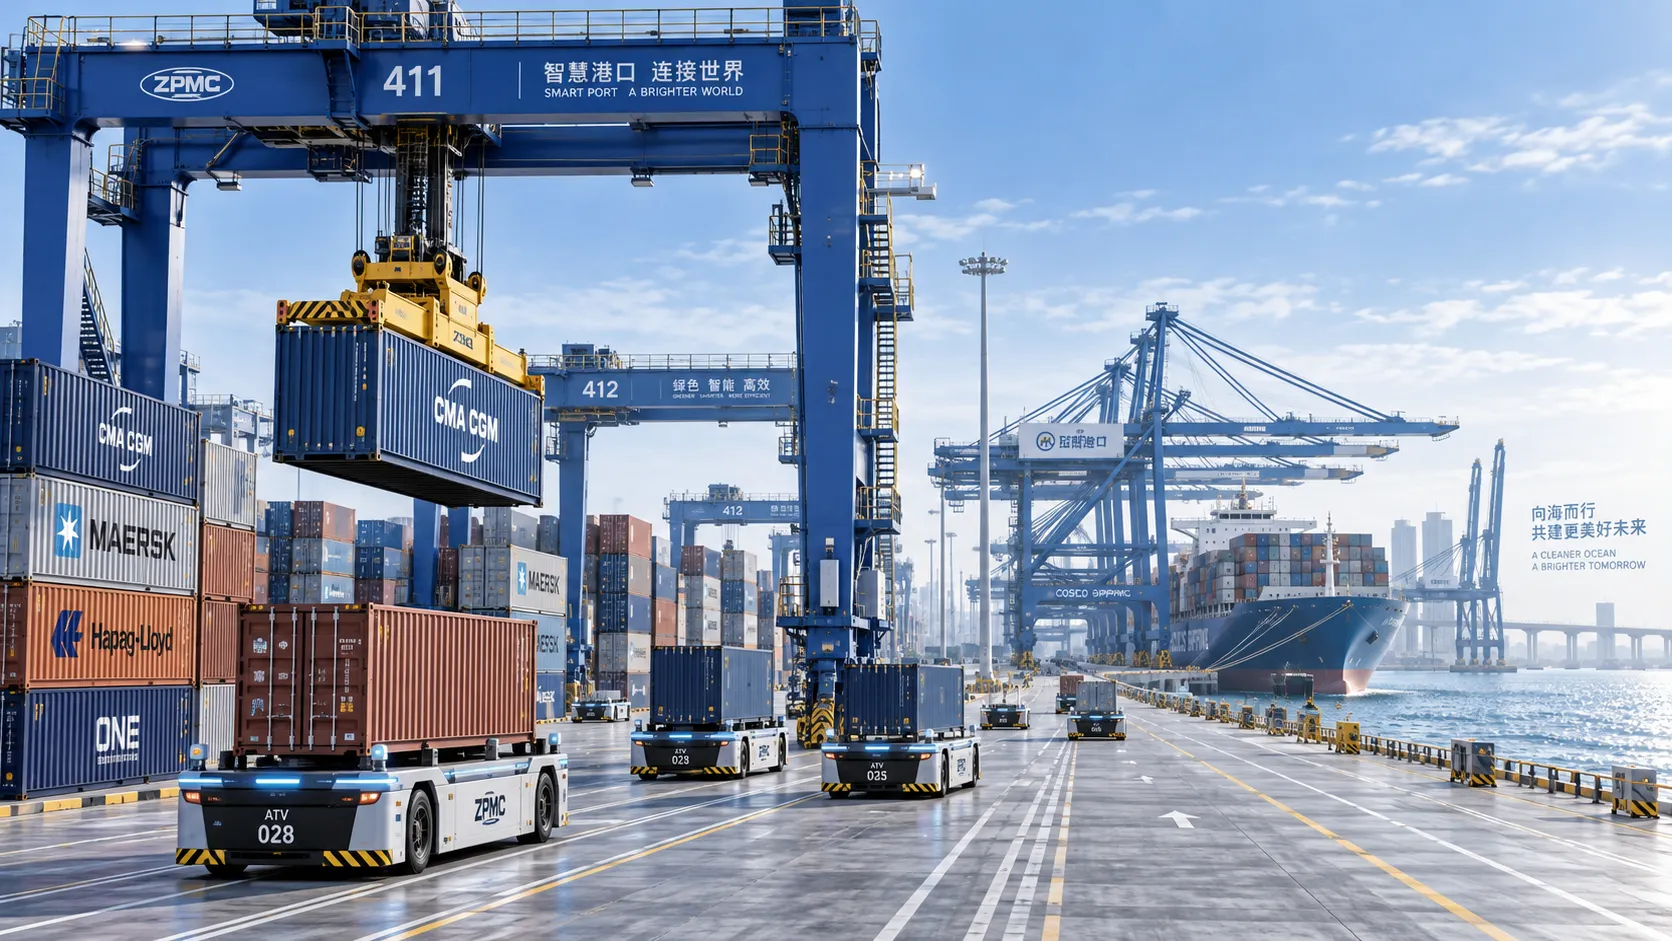
Terminal Automation Technologies That Raise Container Throughput Without Yard Disruption
Terminal automation technology that increases container throughput without disrupting yard flow. Explore smarter integration, resilient workflows, and phased deployment strategies.
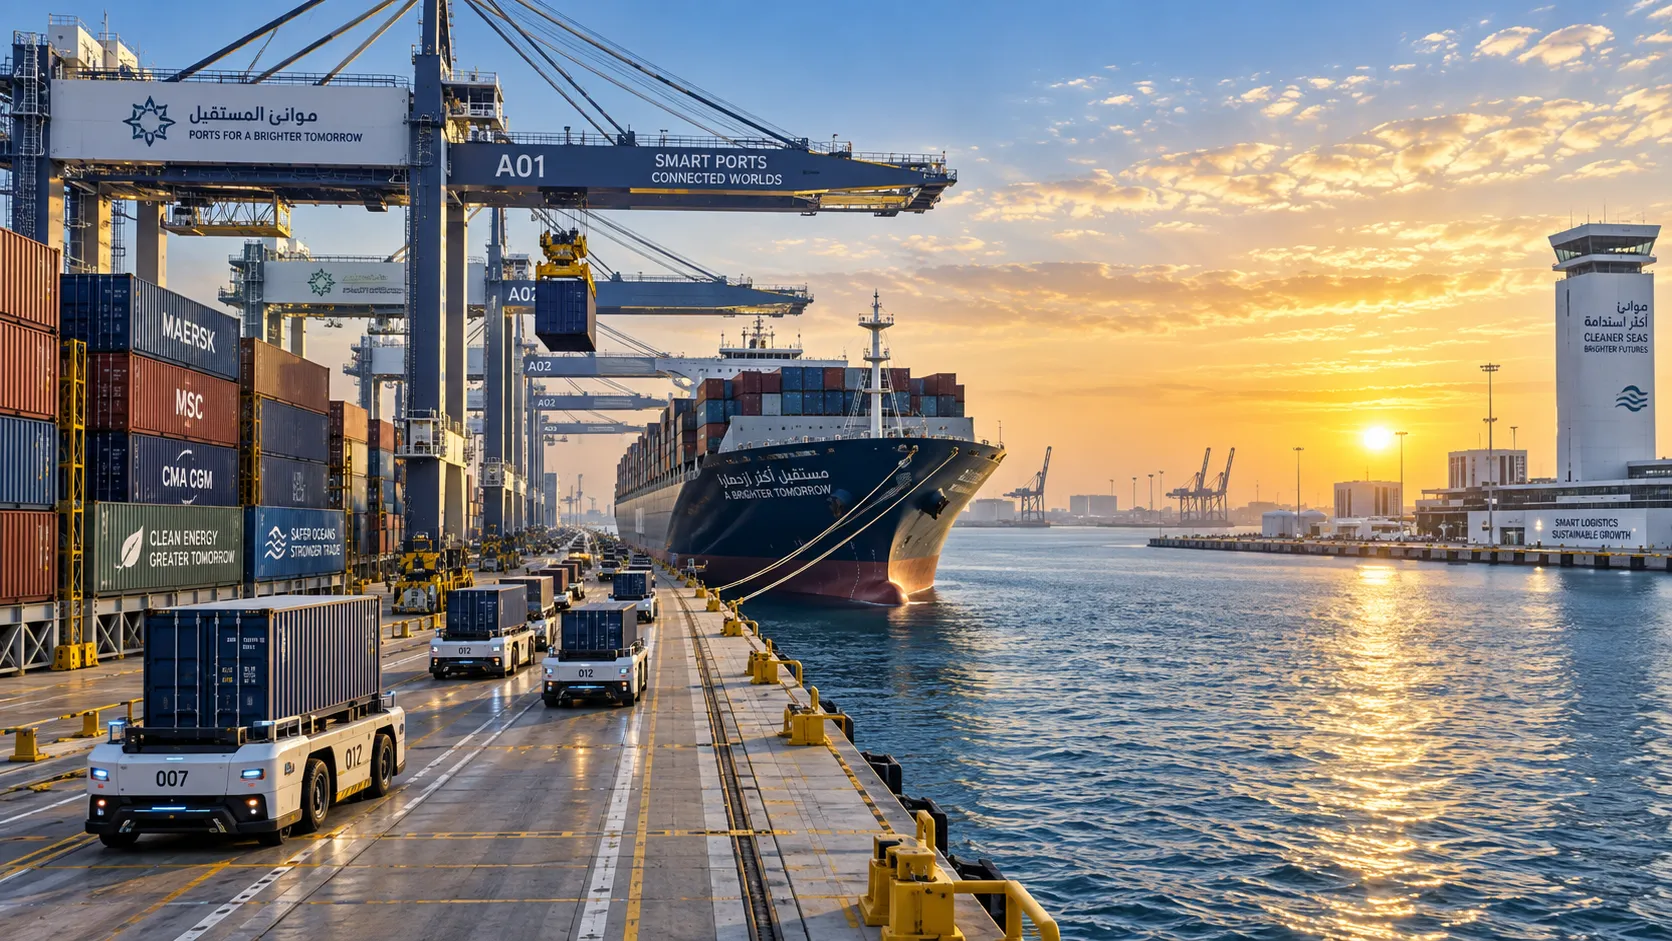
Middle East Port Automation: Key Market Drivers, Projects, and Investment Risks
Port automation systems Middle East: explore market drivers, flagship projects, integration challenges, and investment risks shaping smarter, resilient terminals.
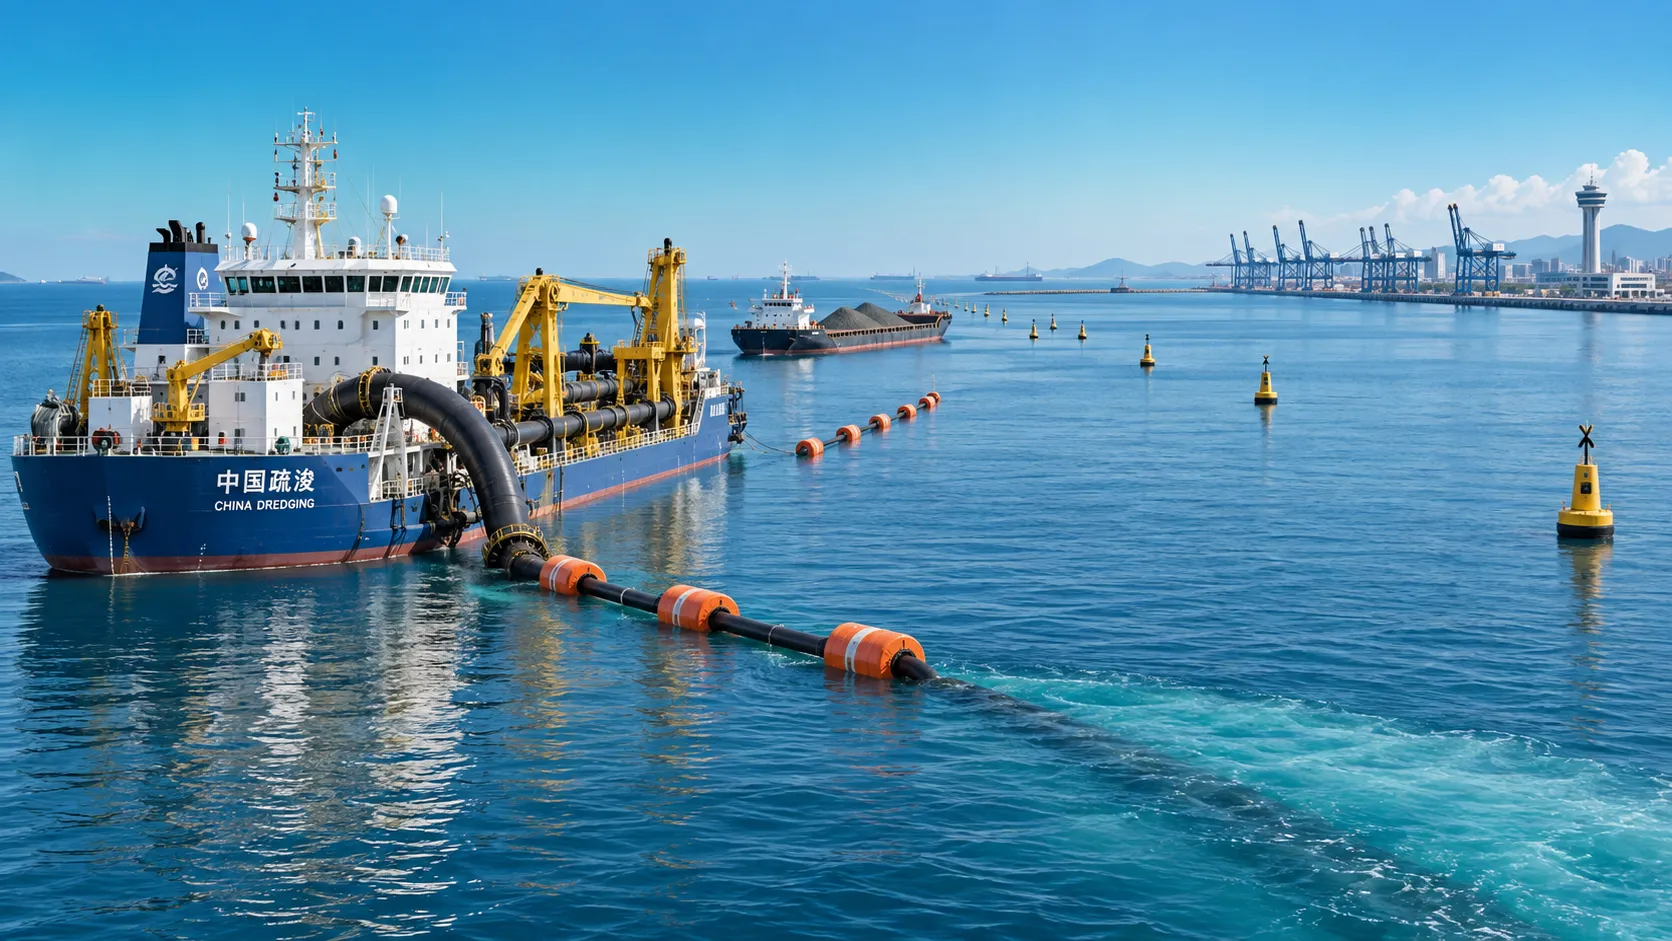
Planning Offshore Dredging Operations: Key Risks, Methods, and Project Controls
Offshore dredging operations demand smart planning. Explore key risks, proven methods, environmental controls, and project strategies for reliable delivery.