Related News
- 00
0000-00
How Can Port Equipment Lead-Time Risk Be Managed? - 00
0000-00
Maritime Logistics Operations: How Ports Can Reduce Container Dwell Time - 00
0000-00
What Does Logistics Node Monitoring Cost Across Warehouses and Transport Hubs? - 00
0000-00
How Can IoT Smart Port Solutions Improve Container Tracking and Yard Efficiency? - 00
0000-00
How Real-Time Port Logistics Intelligence Improves Container Yard Efficiency
Mega Port Terminal Operations: Which KPIs Matter Most for Capacity Planning?
Mega Port Terminal Operations: Which KPIs Matter Most for Capacity Planning?
In mega port terminal operations, capacity planning is rarely about one visible bottleneck.
A terminal may own enough quay cranes, yard blocks, and trucks, yet still lose throughput.
The reason is simple.
Real capacity depends on how assets, labor, berth windows, and yard flows interact over time.
That is why the right KPI stack matters more than isolated equipment counts.
For mega port terminal operations, the strongest indicators do two things.
They reveal where throughput is truly constrained, and they show when future congestion risk is building.
Why capacity planning fails when KPI selection is too narrow
Many terminals still anchor planning around berth length, annual TEU design capacity, or crane fleet size.
Those figures matter, but they are static.
Mega port terminal operations are dynamic systems shaped by arrival variability, stowage complexity, and inland evacuation speed.
A terminal can look underutilized on paper while suffering severe peak-hour saturation.
This also means poor KPI selection can distort investment decisions.
Executives may approve new cranes when the real issue is yard dwell time.
They may expand yard acreage when the hidden limit is gate or rail synchronization.
In practical terms, capacity planning should track flow, delay, and reliability together.
The core KPI groups that define usable terminal capacity
The most useful KPI framework for mega port terminal operations usually falls into five linked groups.
1. Berth performance KPIs
Berth metrics show whether vessel demand matches waterfront handling capability.
- Berth occupancy rate
- Average vessel waiting time
- Berth productivity by call
- Gross crane rate and net crane rate
- Actual berth window adherence
Berth occupancy above a sustained threshold often signals declining schedule resilience.
Once occupancy rises too high, small delays cascade into queueing and service unreliability.
For mega port terminal operations, occupancy should be judged against call mix and tide constraints.
2. Quay crane and ship-to-shore productivity KPIs
Crane count alone says little about effective capacity.
What matters is how consistently crane resources convert vessel time into completed moves.
- Moves per crane hour
- Moves per vessel hour
- Crane interference time
- Idle time due to landside shortages
- Automation exception rate
A strong gross crane rate can hide a weak end-to-end process.
If cranes pause because AGVs, terminal trucks, or yard cranes are unavailable, true capacity is lower.
3. Yard utilization and dwell KPIs
Yard performance is one of the clearest constraints in mega port terminal operations.
- Yard occupancy by block and container type
- Average and percentile dwell time
- Rehandle ratio
- Stack density by service string
- Empty and reefer slot availability
Average yard occupancy can be misleading.
A terminal may report acceptable utilization while critical export or transshipment blocks are already saturated.
Percentile dwell time is especially useful because extremes drive congestion more than averages do.
4. Horizontal transport and handoff KPIs
In automated and hybrid terminals, transfer flow often decides throughput.
- Vehicle cycle time
- Queue time at transfer points
- Dispatch response time
- Loaded versus empty travel ratio
- Battery or charging downtime for electric fleets
From recent operating shifts, a clearer signal is handoff stability rather than raw fleet size.
Frequent dispatch exceptions weaken the gains expected from terminal automation.
5. Gate, rail, and network evacuation KPIs
Marine-side capacity means little if cargo cannot leave the terminal on time.
- Truck turn time
- Gate transaction time
- Rail slot utilization
- Dual transaction ratio
- Import pickup compliance
In mega port terminal operations, landside friction often creates hidden storage demand.
That extra dwell reduces flexibility for the next vessel wave.
Which KPIs matter most when trade volatility increases
Not every KPI deserves the same weight in every market phase.
When shipping networks become volatile, planners should prioritize metrics that capture variability and recovery speed.
This is where mega port terminal operations need a stronger standard than monthly averages.
Planning models should include hourly peaks, service bunching, and exception scenarios.
How to turn KPI tracking into better capacity decisions
The strongest KPI program does not stop at dashboard reporting.
It connects operational signals to investment timing, automation logic, and service policy.
- Separate design capacity from dependable capacity under peak conditions.
- Track KPIs by process segment, not only terminal-wide averages.
- Use percentile and variance measures beside mean values.
- Link asset utilization to delay causes, not just output totals.
- Review KPI thresholds against vessel mix and alliance schedule changes.
- Test scenarios for labor shortages, weather disruption, and equipment outage.
In actual operations, this approach reduces the risk of solving the wrong constraint.
It also helps justify whether the next dollar should go to cranes, software, yard redesign, or gate digitization.
What a mature KPI model looks like in mega port terminal operations
A mature model combines operational, engineering, and commercial views.
It measures not only throughput, but also predictability and recovery performance.
For example, PS-Nexus closely tracks how automation exception rates affect quay productivity.
It also examines how low-latency control systems influence dispatch precision in unmanned terminals.
That broader view reflects the reality of mega port terminal operations today.
Mechanical power, scheduling logic, and network timing now shape capacity together.
The more advanced the terminal, the less useful siloed KPIs become.
Final view on the KPIs that matter most
The best KPI set for mega port terminal operations is not the longest one.
It is the set that reveals usable capacity, variability exposure, and recovery limits.
In most terminals, the highest-value metrics are vessel waiting time, crane productivity quality, yard dwell percentile, transfer queue time, and truck turn time.
Together, they show whether the port can absorb demand without sliding into chronic congestion.
That is the real test of capacity planning.
For any team refining mega port terminal operations, start by ranking KPIs by decision value, not reporting habit, and then align investment around the constraints those metrics consistently expose.
Related News
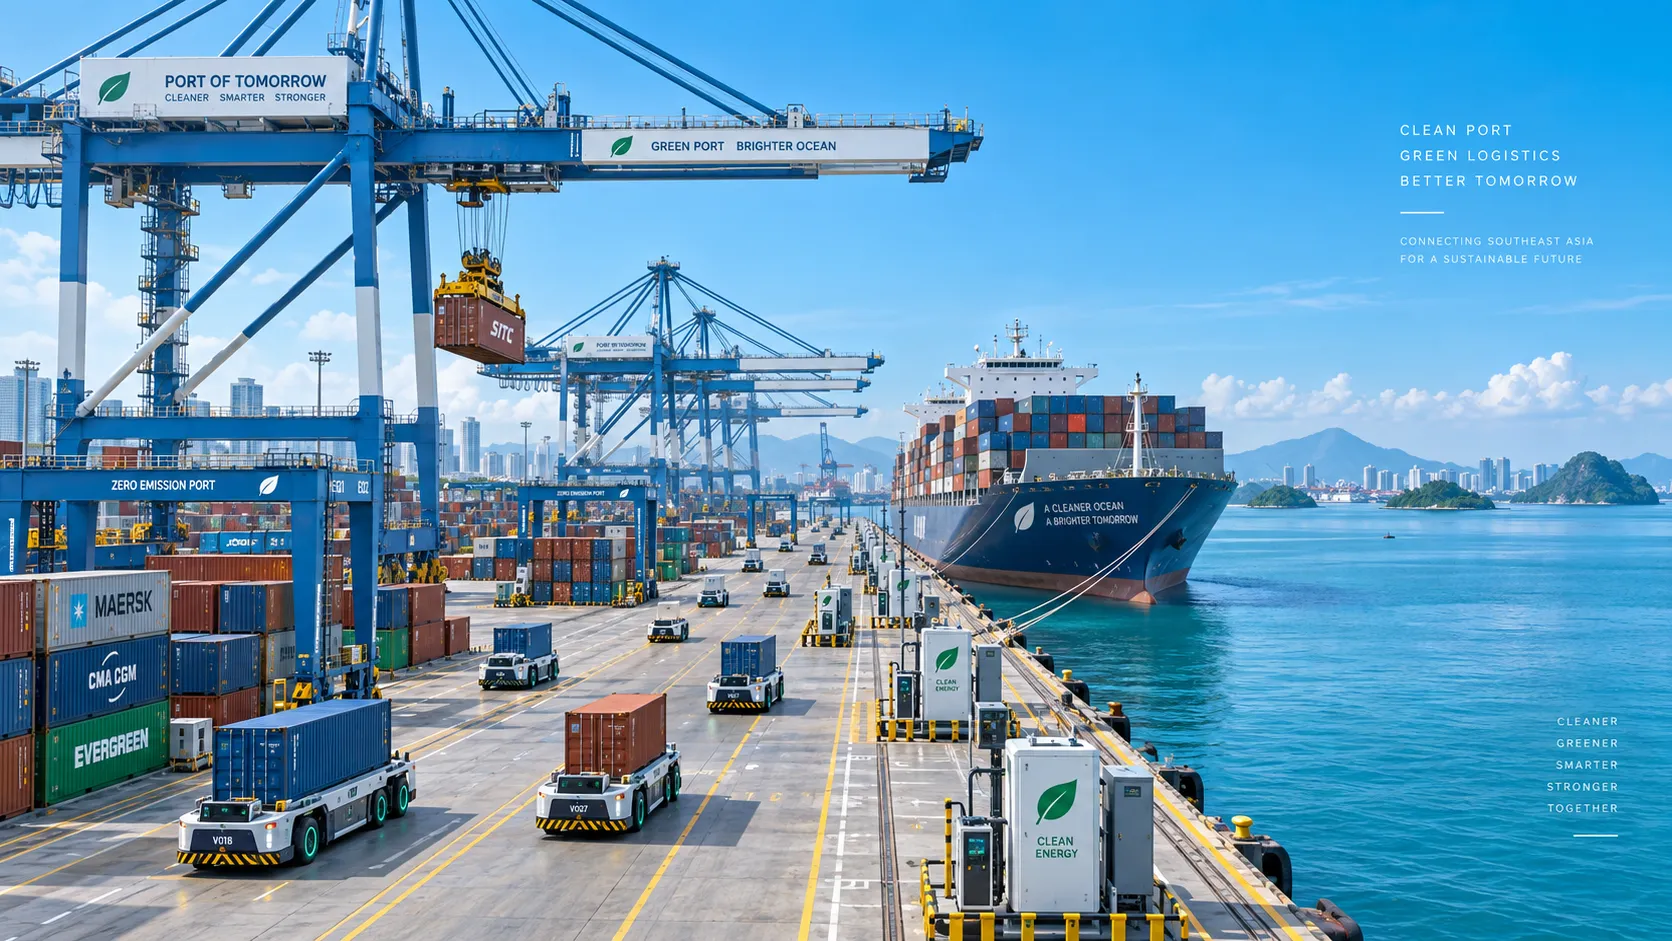
Smart Port Systems in Southeast Asia: Investment Priorities and Adoption Barriers
Smart port systems Southeast Asia: discover investment priorities, adoption barriers, and practical steps to build resilient, connected, high-performing terminals.

How to Evaluate Terminal Efficiency Solution Suppliers for High-Throughput Operations
Choose a terminal efficiency solutions supplier with confidence. Explore proven criteria for throughput, integration, lifecycle cost, safety, and reliable delivery.
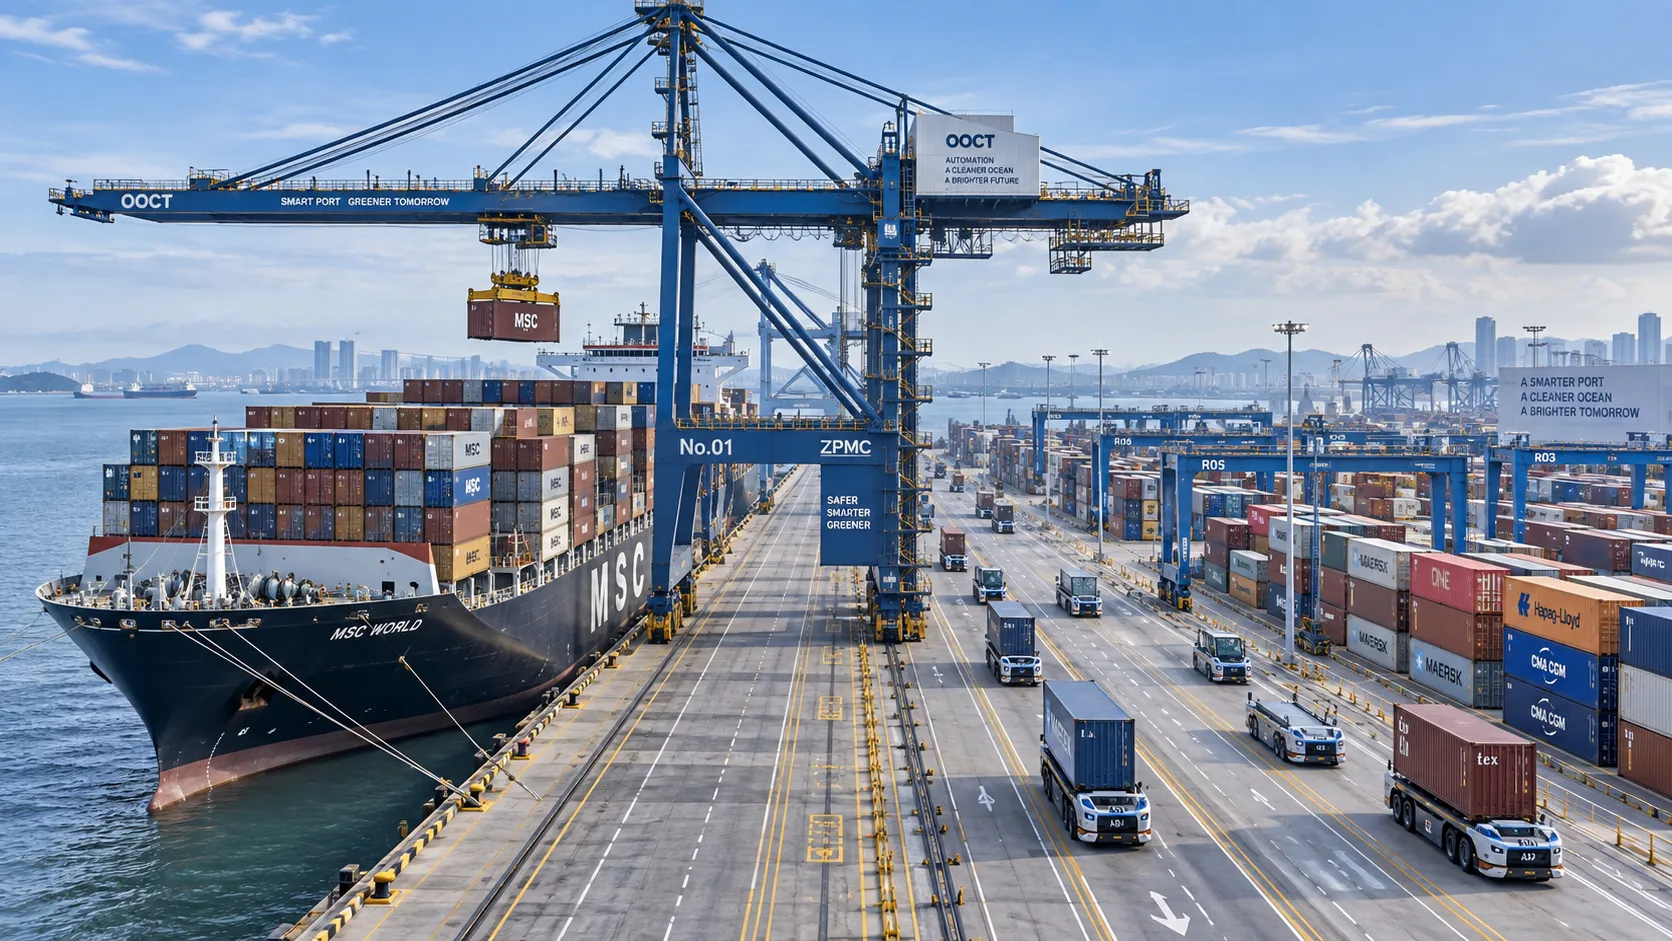
How to Specify a Quay Crane for Container Terminals by Vessel Size and Throughput?
Quay crane for container terminals: learn how to match outreach, lift height, capacity, automation, and cycle performance to vessel size and throughput goals.
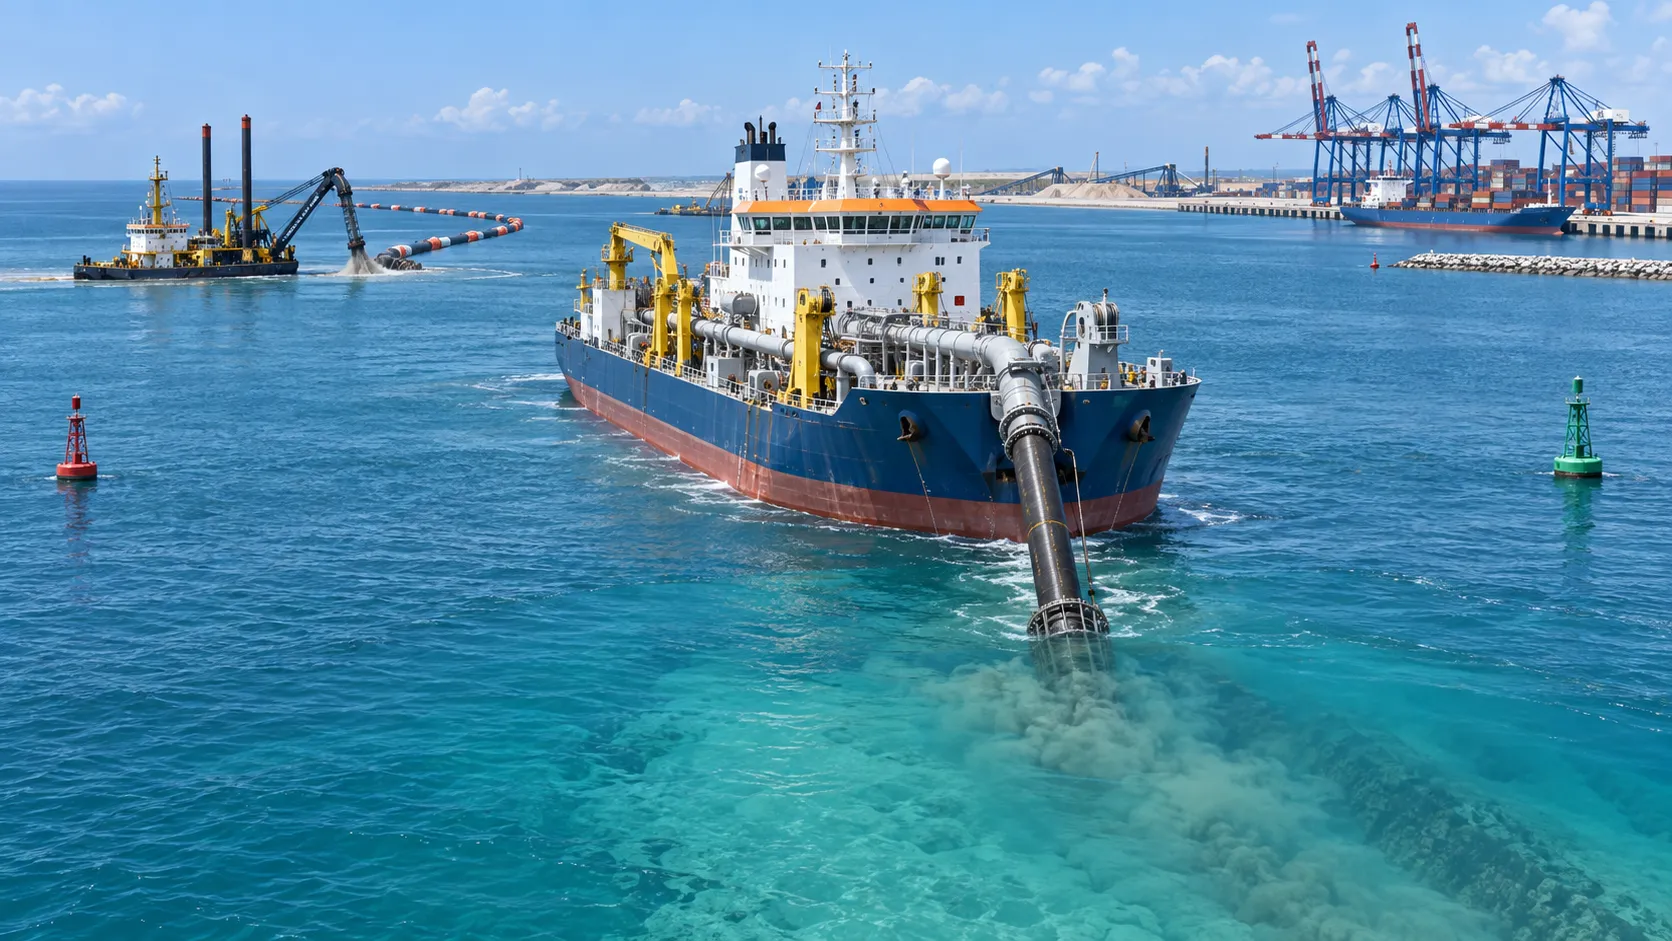
What Dredging Equipment Is Needed for Channel Deepening?
What dredging equipment is needed for channel deepening? Explore dredgers, pipelines, survey tools, and planning strategies for safer, more efficient port access.
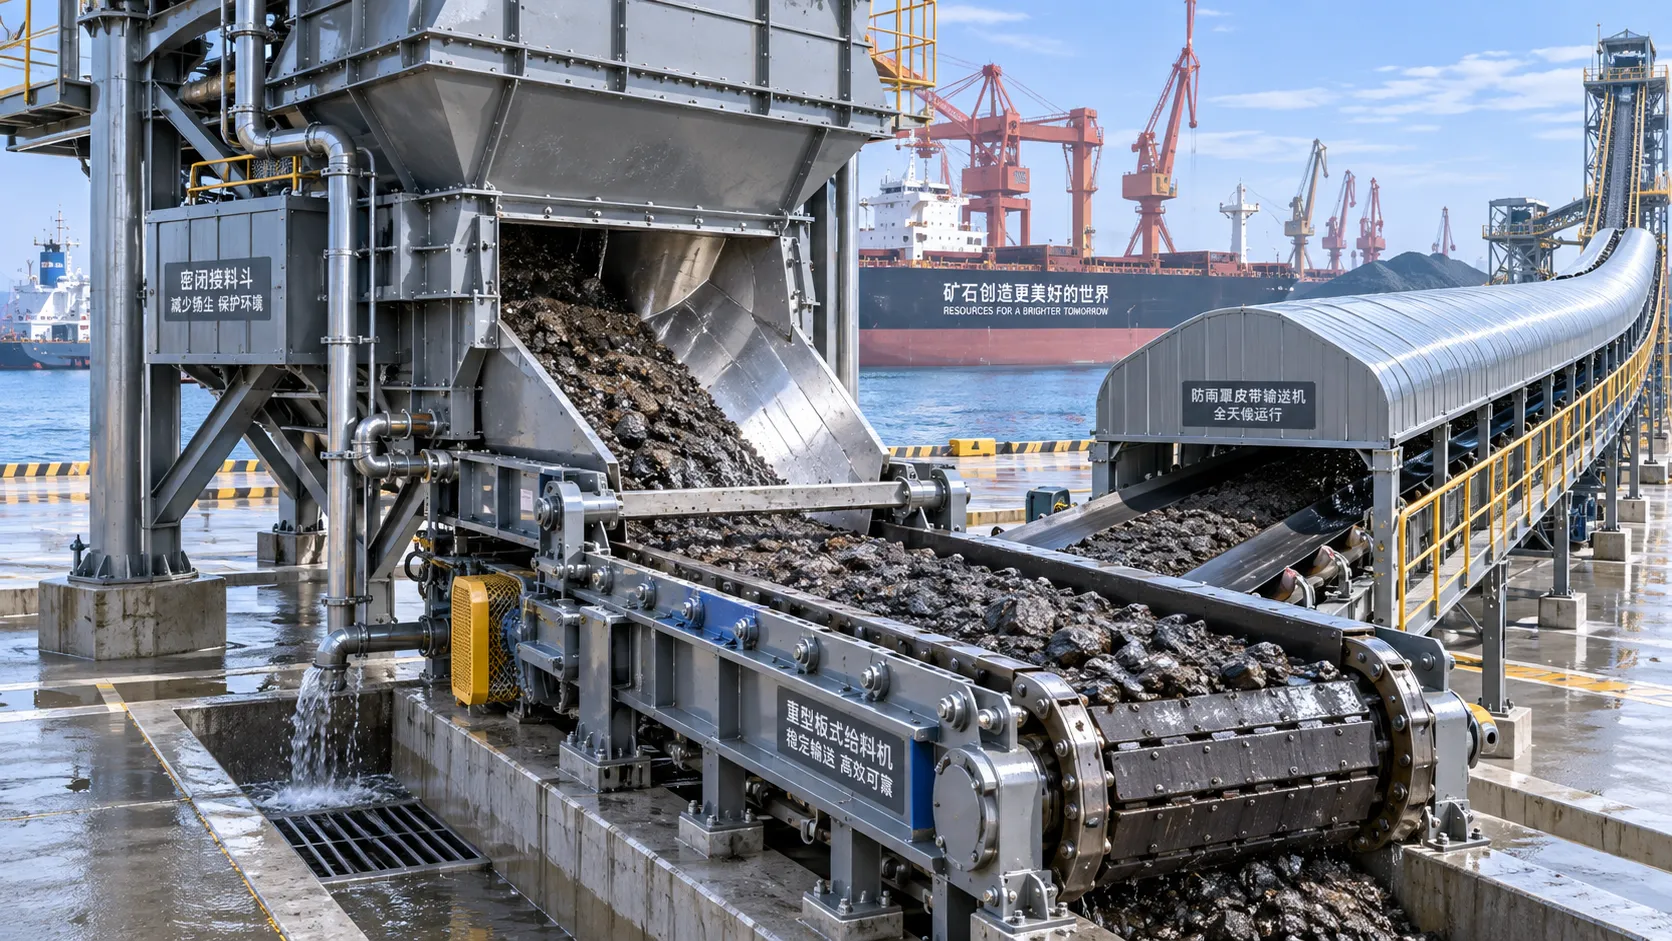
Which Bulk Handling Equipment Suits High-Moisture Cargo?
Which bulk handling equipment suits high-moisture cargo? Compare belt, apron, screw, drag, and slurry systems for reliable flow, less carryback, and higher terminal uptime.
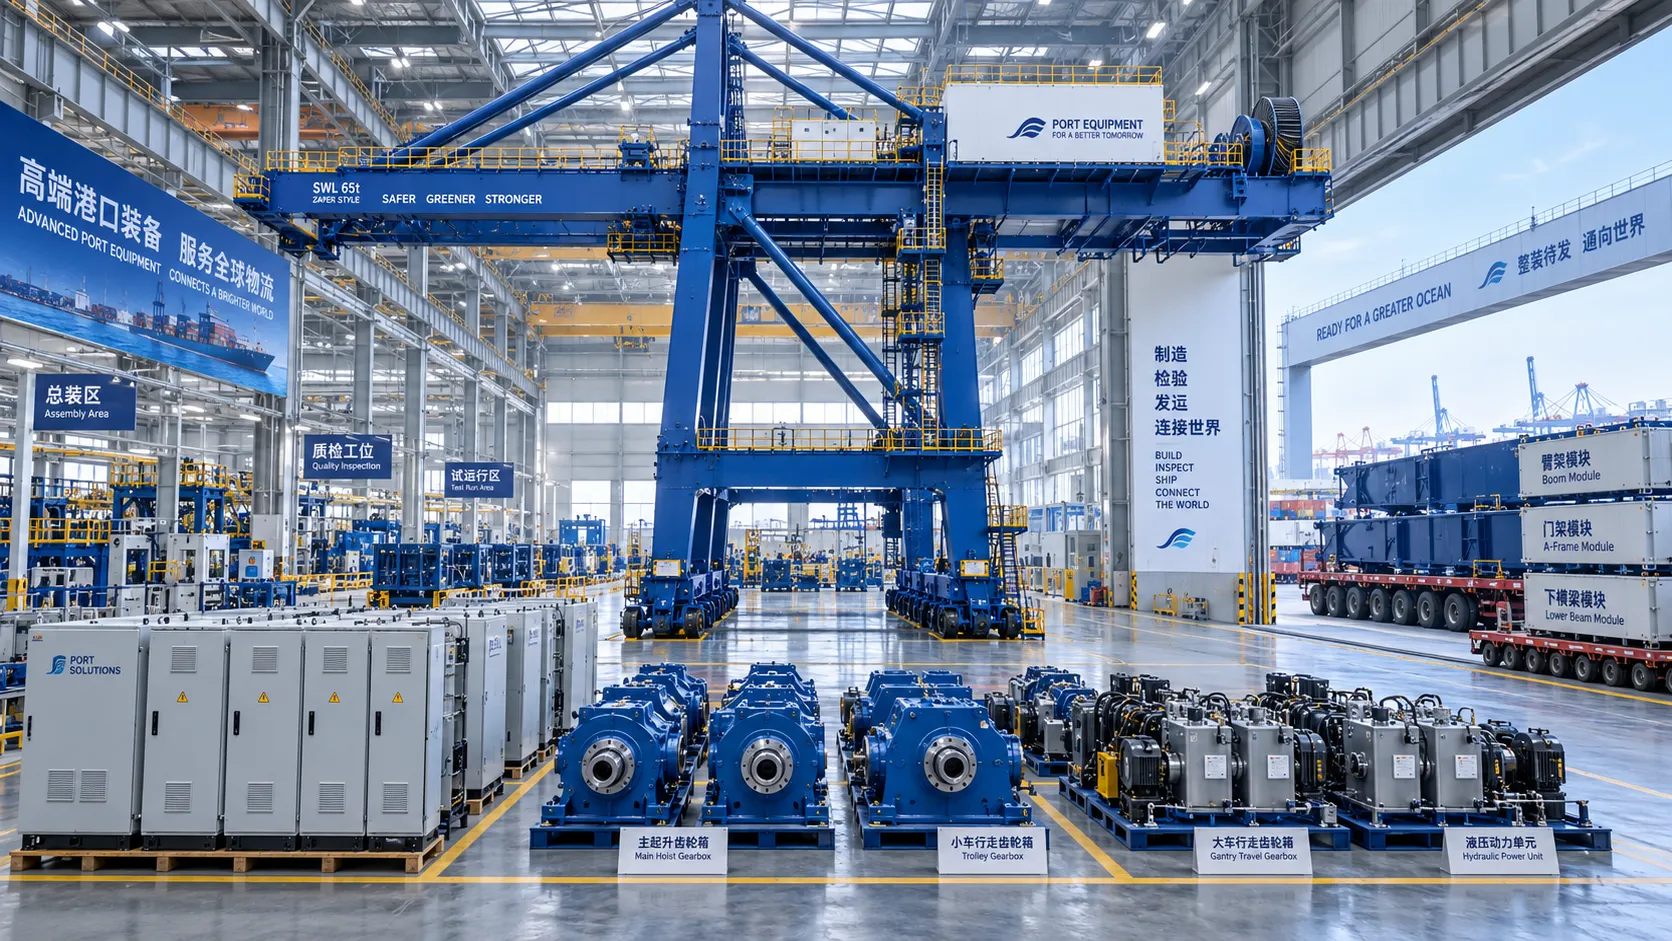
How Can Port Equipment Lead-Time Risk Be Managed?
How can port equipment lead-time risk be managed? Explore practical strategies to control critical paths, suppliers, transport, site readiness, and commissioning delays.
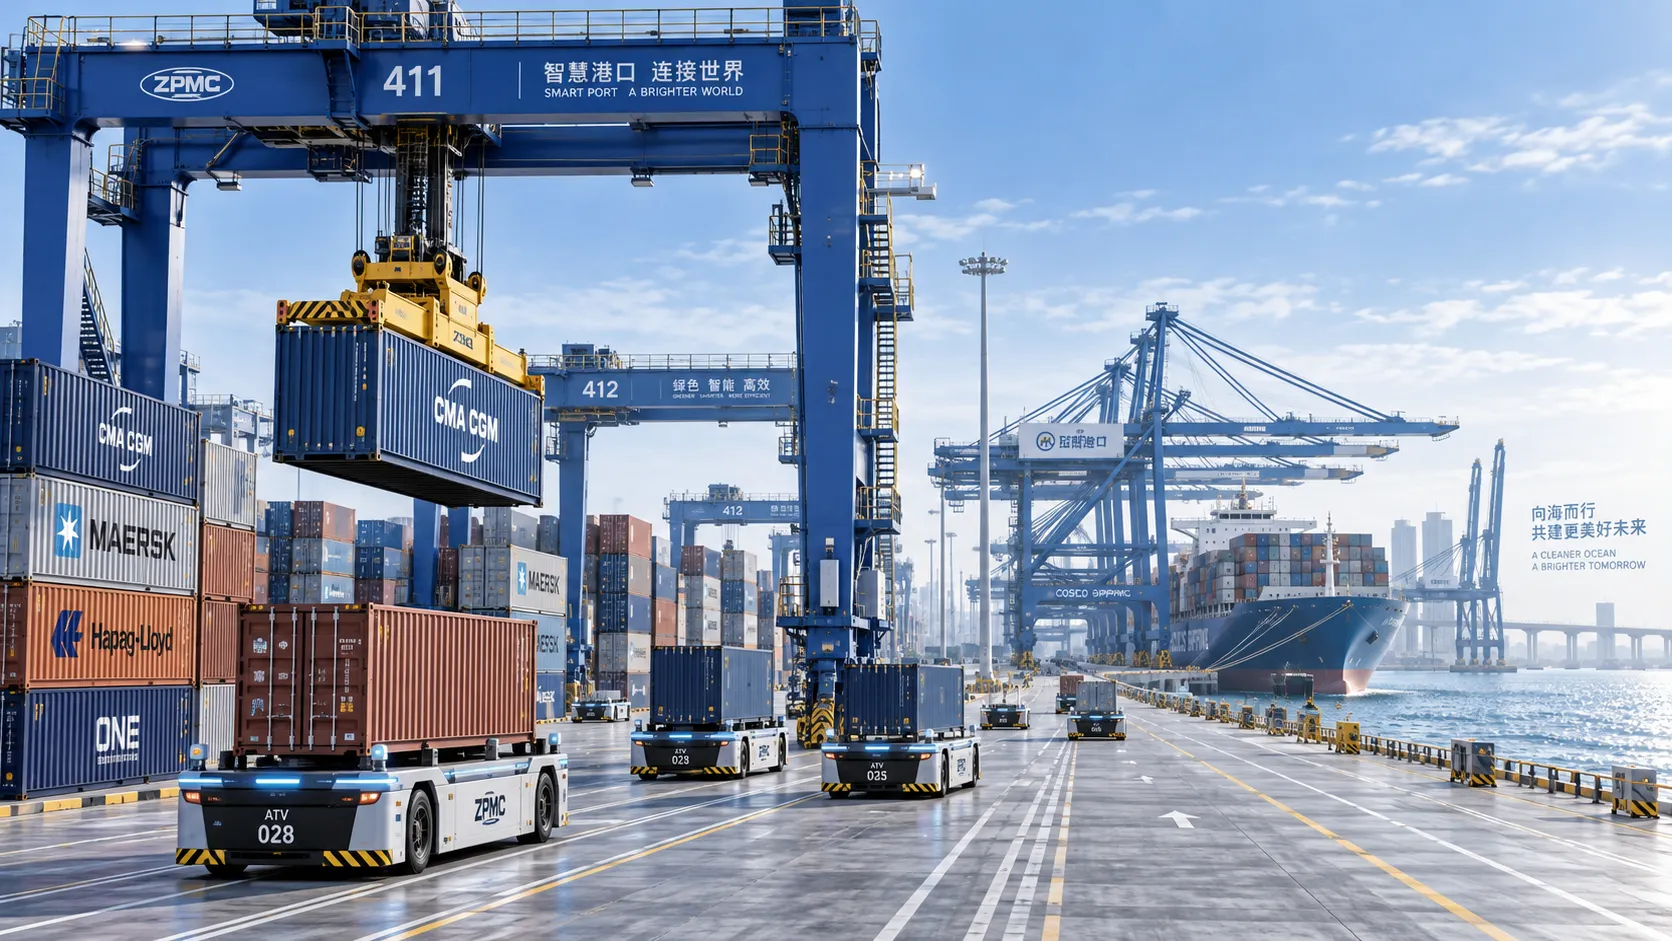
Terminal Automation Technologies That Raise Container Throughput Without Yard Disruption
Terminal automation technology that increases container throughput without disrupting yard flow. Explore smarter integration, resilient workflows, and phased deployment strategies.
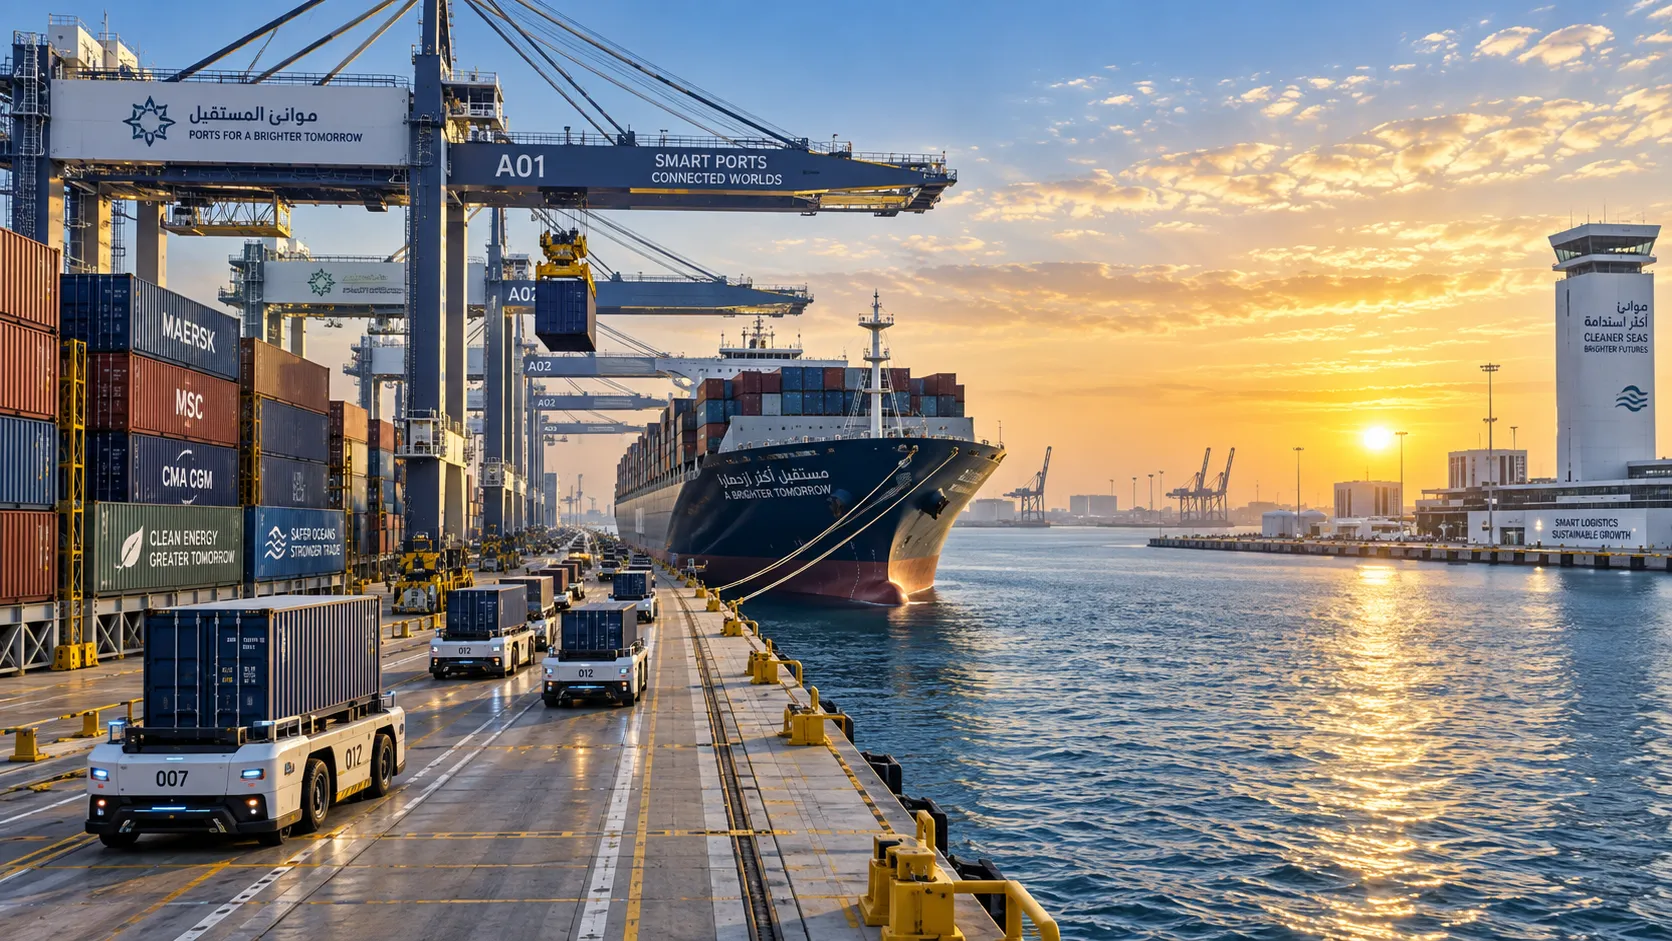
Middle East Port Automation: Key Market Drivers, Projects, and Investment Risks
Port automation systems Middle East: explore market drivers, flagship projects, integration challenges, and investment risks shaping smarter, resilient terminals.
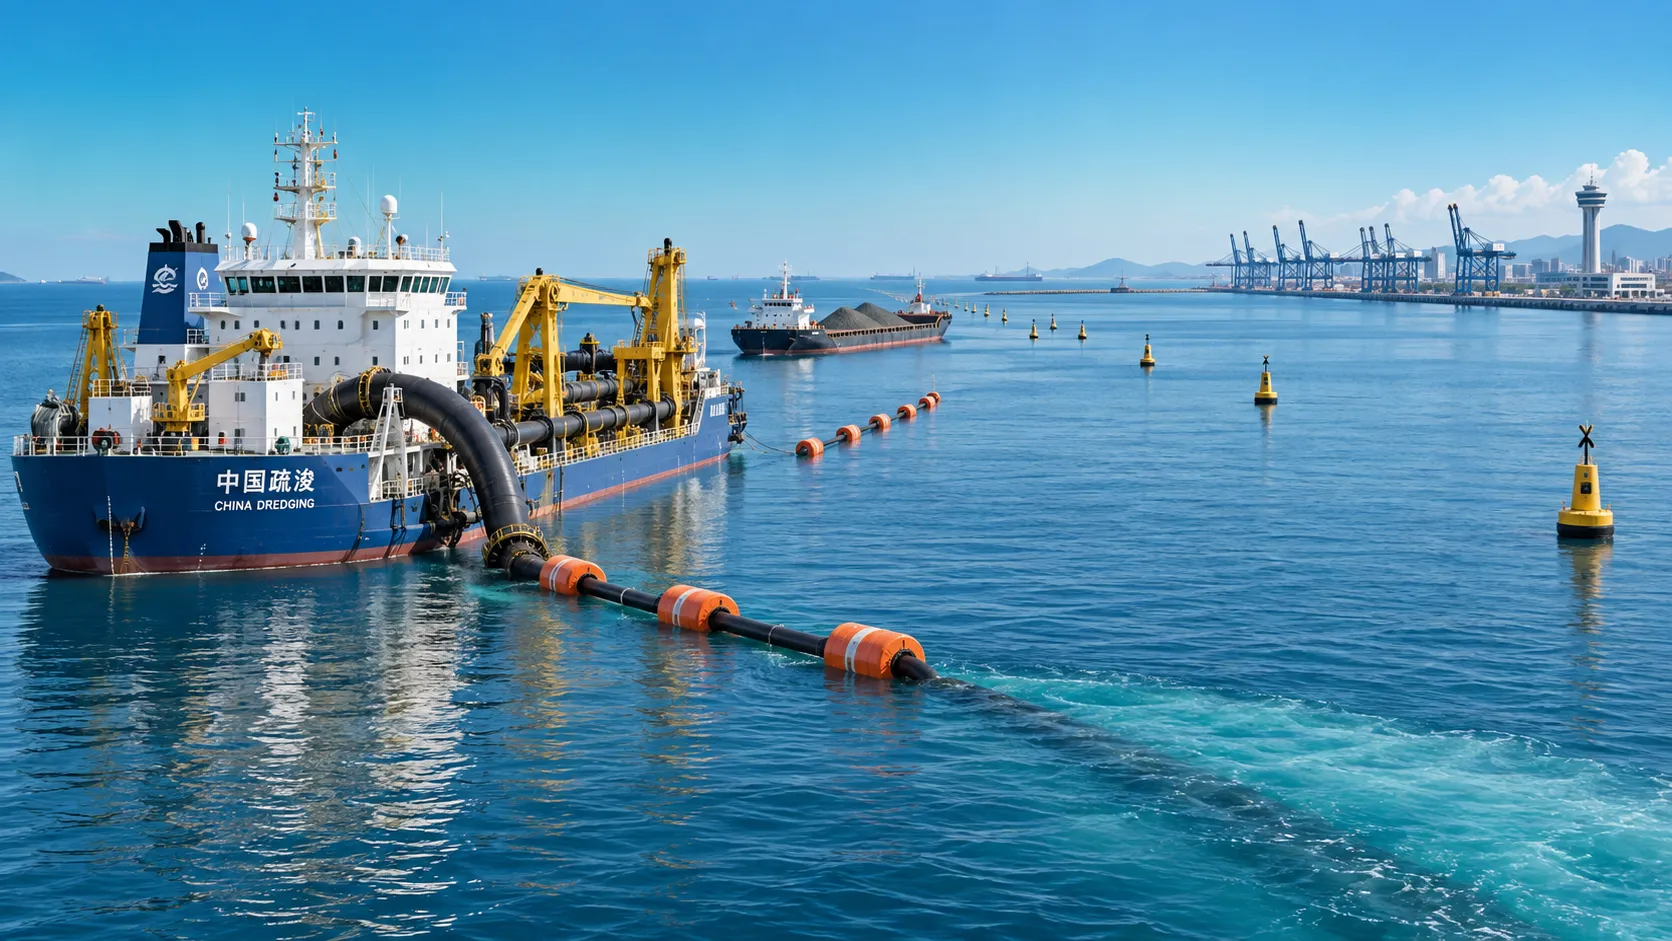
Planning Offshore Dredging Operations: Key Risks, Methods, and Project Controls
Offshore dredging operations demand smart planning. Explore key risks, proven methods, environmental controls, and project strategies for reliable delivery.