Related News
- 00
0000-00
How to Specify a Quay Crane for Container Terminals by Vessel Size and Throughput? - 00
0000-00
Which Bulk Handling Equipment Suits High-Moisture Cargo? - 00
0000-00
Terminal Automation Technologies That Raise Container Throughput Without Yard Disruption - 00
0000-00
Planning Offshore Dredging Operations: Key Risks, Methods, and Project Controls - 00
0000-00
Where Do Automated Guided Vehicles Deliver the Fastest Warehouse Gains in the Middle East?
How smart operations solutions cut delays across terminals
Across modern terminals, even small process gaps can trigger costly vessel queues, yard congestion, and missed delivery windows. Smart operations solutions are helping port leaders reduce these delays by connecting equipment, data, and scheduling decisions in real time. For enterprise decision-makers, this means a clearer path to higher throughput, lower operating risk, and more resilient terminal performance in an increasingly demanding global logistics environment.
For boards, operators, and investment teams responsible for terminal performance, delays are rarely caused by one isolated failure. They usually emerge from 3 to 5 weak links acting together: inconsistent berth planning, slow equipment dispatch, poor yard visibility, uncoordinated gate flows, or maintenance events that arrive at the wrong moment.
That is why smart operations solutions matter beyond automation alone. In the port and maritime logistics sector, the real value comes from synchronizing cranes, AGVs, trucks, yard blocks, dredging support schedules, and control systems into one operating logic. When that logic improves, terminals can often reduce idle minutes, smooth handoffs, and protect service windows without adding major physical capacity.
Why terminal delays persist even in well-equipped ports
Many terminals already operate advanced quay cranes, RTGs, RMGs, stackers, and terminal operating systems. Yet delays continue because asset quality alone does not guarantee flow quality. A terminal may have 8 ship-to-shore cranes and hundreds of daily moves, but if dispatch logic is fragmented, every transfer step accumulates friction.
In practical terms, delay risk often builds across 4 layers: berth allocation, yard planning, equipment routing, and exception handling. If updates move with 10- to 20-minute lag instead of near real time, decisions become reactive. That lag can be enough to create vessel waiting time, truck turn-time inflation, and missed cutoff windows for export containers.
The most common operational bottlenecks
For enterprise decision-makers, it helps to separate symptoms from root causes. Congestion is visible, but the trigger may sit upstream in scheduling rules, data handoffs, or maintenance coordination. Smart operations solutions address these underlying issues by creating a shared operational picture across people, machines, and software.
- Berth plans updated too slowly for late vessel arrival changes
- Yard block assignment that increases rehandles above acceptable thresholds
- Crane, truck, and AGV dispatch based on static rules rather than live workload
- Maintenance tasks scheduled without considering peak gate or vessel windows
- Data silos between TOS, equipment control, and remote operations platforms
Why “small delays” become expensive quickly
A 6-minute pause in crane availability can ripple into 20 to 40 minutes of downstream disruption if yard vehicles queue at the wrong block. A truck turn time rising from 38 minutes to 57 minutes may not sound severe in isolation, but over 400 to 800 gate transactions per day, the cumulative loss is significant. The same principle applies to dredging support logistics, where channel access timing can affect berth windows and vessel sequencing.
The table below outlines where delay pressure typically starts and how smart operations solutions are used to contain it.
The main takeaway is that terminal delay is usually a coordination problem before it becomes a hardware problem. This is exactly where smart operations solutions produce measurable value: they improve timing, visibility, and dispatch quality across interconnected assets.
What smart operations solutions actually do inside a terminal
The phrase can sound broad, so decision-makers should look at function rather than branding. In port environments, smart operations solutions typically combine 5 core capabilities: live data integration, planning optimization, equipment orchestration, predictive maintenance support, and exception management. Their purpose is not only to automate tasks, but to reduce decision latency.
For example, a remote-control crane network may require low-latency communications below 50 milliseconds for stable operating response. AGV path planning may need continuous recalculation when block access changes. Pump or dredging support systems may rely on digital monitoring intervals of 1 to 5 seconds to detect pressure or performance anomalies early.
Core building blocks of a delay-reduction architecture
An effective architecture does not need to be built all at once. Many terminals phase it in over 3 stages, starting with visibility, then optimization, then semi-autonomous or fully automated execution. This lowers implementation risk while giving leadership clearer ROI checkpoints.
- Data layer: connects TOS, equipment sensors, gate systems, and maintenance records
- Decision layer: analyzes workload, queue conditions, route options, and constraints
- Execution layer: issues dispatch instructions to cranes, vehicles, control rooms, or maintenance teams
How the technology improves flow
When a vessel arrives 2 hours late, traditional operations may require manual rescheduling across several teams. With smart operations solutions, the system can automatically rebalance crane assignments, yard receiving priorities, and truck or AGV routing. That response speed matters because delay containment in the first 15 to 30 minutes is often more valuable than recovering later.
Below is a practical comparison of conventional coordination versus a smart operating model used across modern terminal environments.
The difference is not cosmetic. Faster updates, better routing, and predicted downtime reduce operational variability. For enterprise buyers, that means smarter use of existing capex before committing to additional fleet or yard expansion.
Where enterprise decision-makers see the strongest business impact
Executives do not invest in digital systems just to modernize dashboards. They invest to improve throughput, protect service commitments, and reduce cost leakage. In terminals, smart operations solutions influence all three. Even a 5% to 12% reduction in non-productive equipment time can materially improve berth productivity when move density is high.
The value is especially strong in operations with volatile arrival patterns, mixed cargo handling, or expansion pressure. That includes container terminals, bulk logistics nodes, specialized handling yards, and integrated sites where dredging support, channel access planning, and marine logistics have to align with landside schedules.
Business outcomes that matter at board level
- Higher berth productivity without immediate civil expansion
- Lower queue and dwell risk during peak windows lasting 6–18 hours
- Better labor allocation through exception-based supervision
- Reduced fuel or power waste from idle or empty equipment movement
- More predictable service levels for carriers, shippers, and inland partners
Risk reduction is often the hidden return
The clearest gains are sometimes not visible in a single KPI. Better synchronization lowers the chance of compounded disruption. If one yard block closes unexpectedly, the system can redirect flows before crane productivity collapses. If weather, tide, or dredging activity affects one zone, revised dispatch logic can preserve the wider operating plan. This resilience is critical when service contracts impose narrow delivery windows or penalty exposure.
For PS-Nexus audiences, this matters because terminal competitiveness increasingly depends on both mechanical strength and algorithmic discipline. Hardware defines the ceiling, but operations intelligence determines how often that ceiling is reached.
How to evaluate smart operations solutions before procurement
Procurement should not start with interface design or vendor claims. It should start with operational fit. Decision-makers need to test whether a solution can handle their cargo mix, equipment fleet, control philosophy, and data conditions. In most terminal projects, 4 evaluation dimensions should be reviewed before commercial comparison begins.
Four procurement questions that prevent expensive mismatches
- Can the system integrate with existing TOS, PLC, SCADA, and equipment control layers?
- How quickly can it process event changes—seconds, minutes, or longer?
- Does the optimization logic reflect yard rules, safety constraints, and marine-side realities?
- What level of local support, training, and phased rollout capability is available?
A practical evaluation checklist
The table below can be used during RFI or pre-bid review. It focuses on decision criteria that directly affect delay reduction rather than generic software features.
A strong procurement process also defines acceptance metrics early. Typical measures include truck turn time, average rehandles per box, berth productivity, equipment idle ratio, and response time to exception events. A 90-day pilot with baseline comparison often gives more actionable insight than a feature-heavy demo.
Implementation priorities: from pilot to terminal-wide adoption
Successful deployment usually follows a phased model. For most terminals, a realistic path spans 3 stages over 4 to 12 months depending on integration complexity, automation maturity, and change management requirements. Smart operations solutions deliver best when operational teams are involved early, not only at final commissioning.
A practical rollout sequence
- Map delay sources and establish a 30- to 60-day baseline for current performance
- Launch one bounded use case such as yard dispatch, berth re-planning, or maintenance scheduling
- Validate KPI improvement, operator adoption, and system stability before wider expansion
Common implementation mistakes to avoid
- Trying to automate all workflows at once instead of targeting the top 2 delay drivers
- Ignoring data cleanliness in equipment events and timestamp consistency
- Using generic optimization logic without terminal-specific yard and marine constraints
- Skipping training for supervisors who must manage exception-based operations
Terminals that treat smart operations solutions as an operating model, not just a software purchase, tend to scale more effectively. The goal is to create disciplined coordination between terminal gear, control systems, and commercial service commitments. That aligns closely with the PS-Nexus view of modern ports as integrated systems where heavy equipment, communications, and intelligence must function as one synchronized network.
Delays across terminals rarely disappear through equipment investment alone. They fall when planning, dispatch, visibility, and maintenance decisions move faster and with better context. Smart operations solutions give enterprise decision-makers a practical route to higher throughput, lower disruption risk, and stronger operational resilience across container handling, bulk logistics, and marine-side support environments.
If your organization is assessing how to cut queues, improve yard flow, or align automation investments with measurable terminal outcomes, now is the right time to review the operational architecture behind your current delays. Contact PS-Nexus to explore tailored intelligence, evaluate implementation paths, and learn more solutions for smarter port performance.
Related News
Smart Port Systems in Southeast Asia: Investment Priorities and Adoption Barriers
Smart port systems Southeast Asia: discover investment priorities, adoption barriers, and practical steps to build resilient, connected, high-performing terminals.
How to Evaluate Terminal Efficiency Solution Suppliers for High-Throughput Operations
Choose a terminal efficiency solutions supplier with confidence. Explore proven criteria for throughput, integration, lifecycle cost, safety, and reliable delivery.
How to Specify a Quay Crane for Container Terminals by Vessel Size and Throughput?
Quay crane for container terminals: learn how to match outreach, lift height, capacity, automation, and cycle performance to vessel size and throughput goals.
What Dredging Equipment Is Needed for Channel Deepening?
What dredging equipment is needed for channel deepening? Explore dredgers, pipelines, survey tools, and planning strategies for safer, more efficient port access.
Which Bulk Handling Equipment Suits High-Moisture Cargo?
Which bulk handling equipment suits high-moisture cargo? Compare belt, apron, screw, drag, and slurry systems for reliable flow, less carryback, and higher terminal uptime.
How Can Port Equipment Lead-Time Risk Be Managed?
How can port equipment lead-time risk be managed? Explore practical strategies to control critical paths, suppliers, transport, site readiness, and commissioning delays.
Terminal Automation Technologies That Raise Container Throughput Without Yard Disruption
Terminal automation technology that increases container throughput without disrupting yard flow. Explore smarter integration, resilient workflows, and phased deployment strategies.
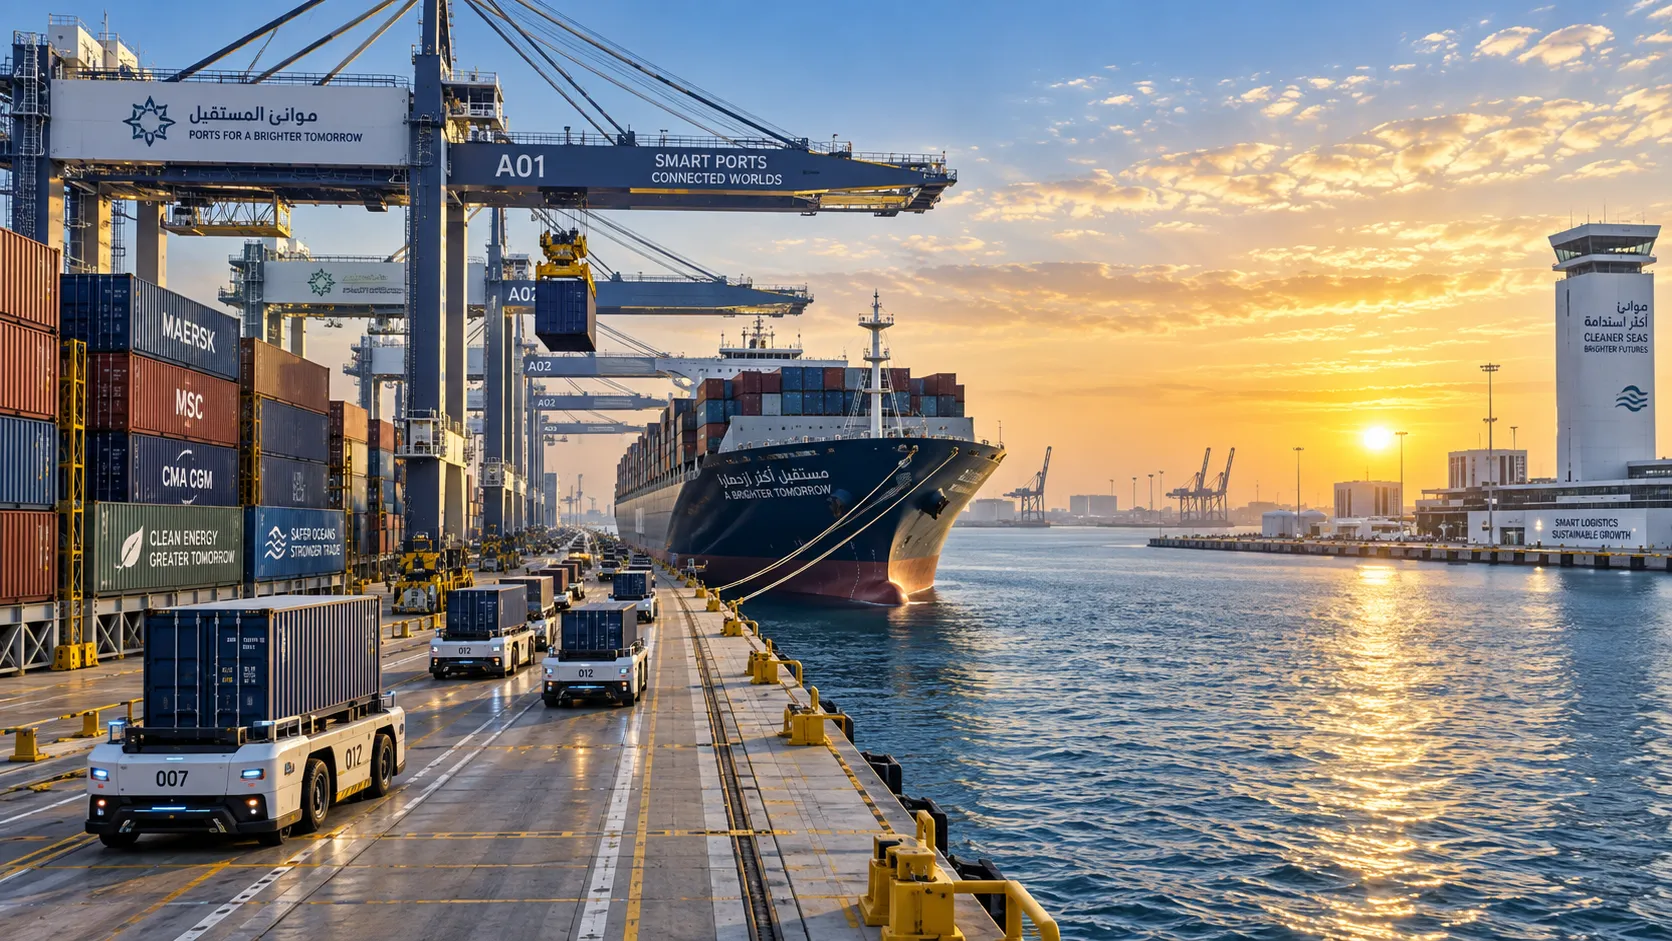
Middle East Port Automation: Key Market Drivers, Projects, and Investment Risks
Port automation systems Middle East: explore market drivers, flagship projects, integration challenges, and investment risks shaping smarter, resilient terminals.
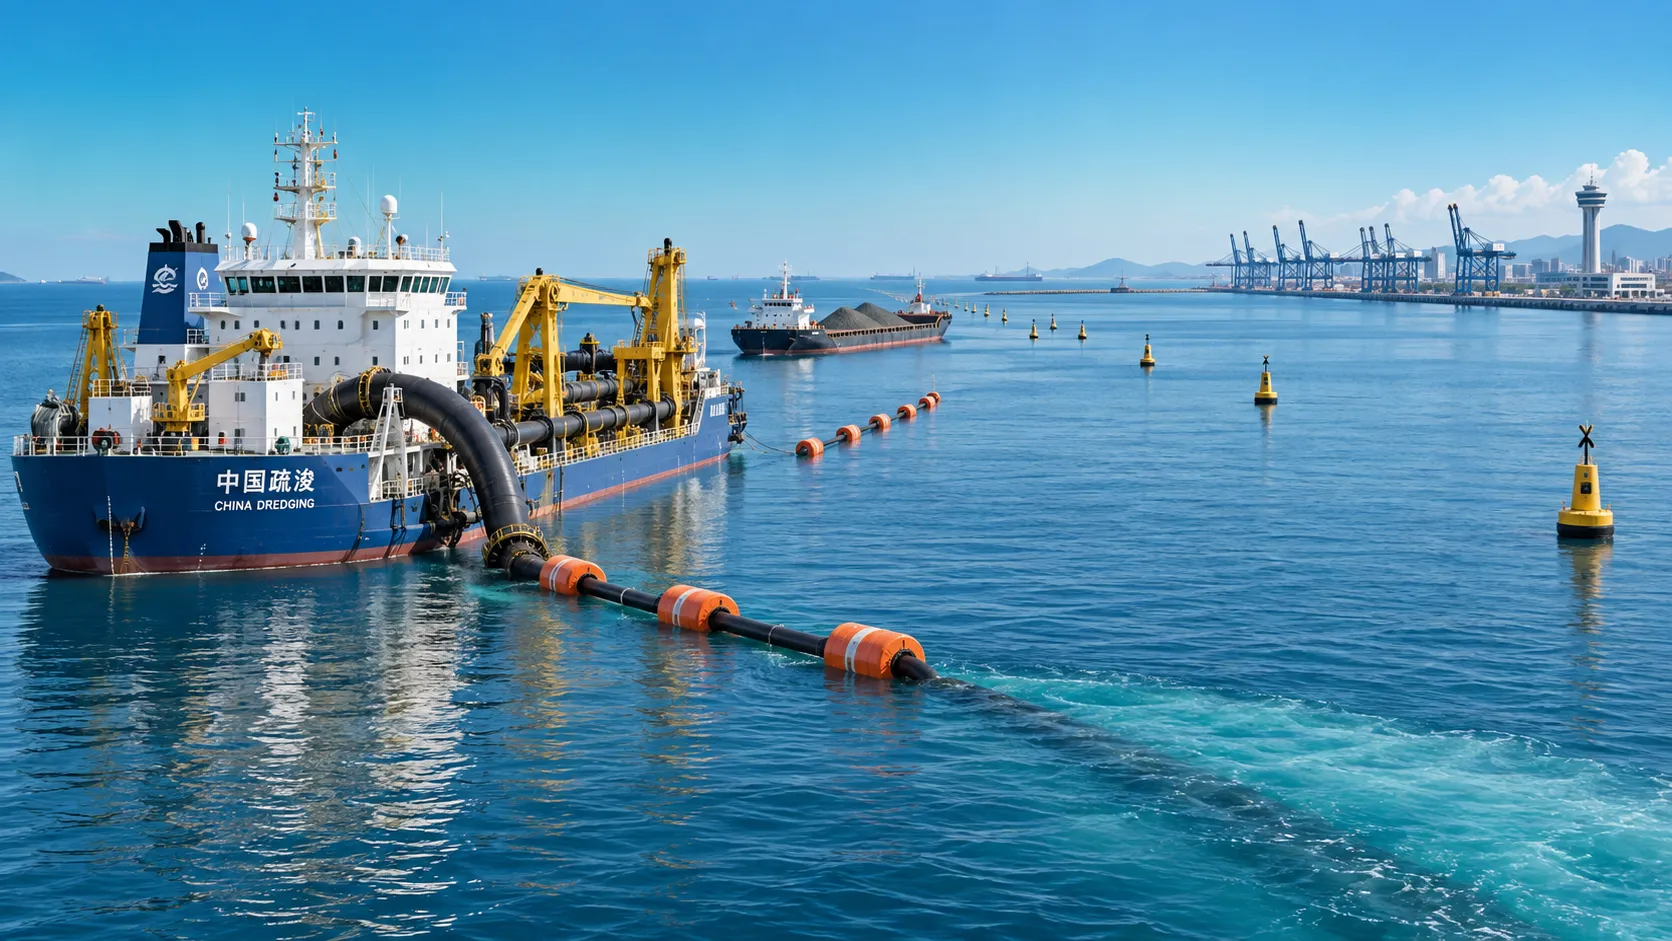
Planning Offshore Dredging Operations: Key Risks, Methods, and Project Controls
Offshore dredging operations demand smart planning. Explore key risks, proven methods, environmental controls, and project strategies for reliable delivery.