Related News
- 00
0000-00
How Can Port Equipment Lead-Time Risk Be Managed? - 00
0000-00
Maritime Logistics Operations: How Ports Can Reduce Container Dwell Time - 00
0000-00
What Does Logistics Node Monitoring Cost Across Warehouses and Transport Hubs? - 00
0000-00
How Can IoT Smart Port Solutions Improve Container Tracking and Yard Efficiency? - 00
0000-00
How Real-Time Port Logistics Intelligence Improves Container Yard Efficiency
What logistics node dynamics reveal about port bottlenecks
What can logistics node dynamics tell us about hidden port bottlenecks before congestion becomes visible? The answer is often found in small operational shifts.
When berth windows drift, yard dwell time rises, and equipment cycles lose rhythm, logistics node dynamics begin to reveal stress.
These signals matter because visible queues are usually late-stage symptoms. By then, costs, delays, and schedule instability have already spread across networks.
For maritime intelligence platforms such as PS-Nexus, logistics node dynamics offer a practical way to read port performance early.
They connect terminal gear, automated handling, dredging constraints, and scheduling logic into one operational picture.
Why logistics node dynamics matter more in today’s port system
Ports no longer fail only at the quay. Bottlenecks now emerge across linked nodes that exchange cargo, data, and timing dependencies.
A terminal may show acceptable crane productivity while truck turn times worsen. Yard density may look manageable while rehandles quietly multiply.
That is why logistics node dynamics have become essential. They highlight how pressure moves between berth allocation, container stacking, gate release, and inland transfer.
This matters across the broader industry, not just marine transport. Retail, energy, manufacturing, and project cargo all depend on stable node coordination.
The first trend signal is mismatch, not collapse
Most bottlenecks begin as mismatches between arrival patterns and handling capacity. Throughput does not suddenly disappear. It becomes uneven.
Logistics node dynamics often show this through alternating surges and idle intervals. Equipment utilization spikes, then falls, creating unstable flow.
A port can appear busy but still underperform. The issue is not volume alone. The issue is whether each node absorbs volume at the right moment.
Common early indicators of hidden friction
- Berth waiting time rises while quay crane output stays flat.
- Yard occupancy increases faster than vessel calls.
- Truck appointment compliance drops during normal demand periods.
- AGV or shuttle paths show repeated routing conflicts.
- Rehandle ratios climb in blocks with mixed cargo priorities.
- Dredging windows or draft limits reduce scheduling flexibility.
Each indicator reflects logistics node dynamics in motion. None alone confirms a bottleneck, but together they expose systemic stress.
What drives these logistics node dynamics beneath the surface
Several forces shape logistics node dynamics. Some are physical, some digital, and some tied to changing trade patterns.
This mix explains why logistics node dynamics must be interpreted across equipment, systems, and geography rather than in isolated reports.
How port bottlenecks spread from one node to another
A bottleneck rarely stays where it begins. Logistics node dynamics show how disruption migrates through the port chain.
For example, slow crane discharge can fill temporary yard slots. That forces additional reshuffling, which delays outbound pickups and blocks gate throughput.
In automated terminals, a software dispatch delay may seem minor. Yet it can cascade into queue clustering, idle machines, and missed vessel service windows.
In dredging-sensitive ports, channel maintenance also affects node behavior. Reduced navigational depth can bunch vessel arrivals and strain every downstream resource.
Typical propagation path
- Arrival timing loses alignment.
- Berth and crane assignments become less efficient.
- Yard density rises in priority blocks.
- Horizontal transport waits longer for instructions or routes.
- Gate and rail connections absorb delay variability.
- Network schedules lose reliability beyond the port boundary.
What logistics node dynamics reveal for different business links
The value of logistics node dynamics changes by operational link, but the core benefit is the same: earlier diagnosis.
For terminal operations, these dynamics reveal whether congestion comes from berth planning, yard design, or equipment dispatch logic.
For heavy terminal gear analysis, they show whether mechanical capacity is sufficient or whether coordination losses are suppressing actual throughput.
For automation systems, logistics node dynamics expose weak data handoffs, delayed commands, and path-planning conflicts that reduce expected efficiency gains.
For dredging engineering, they reveal where navigational constraints are quietly limiting berth productivity long before ships visibly queue offshore.
- Terminal gear: cycle stability matters as much as rated speed.
- Container handling: stack discipline shapes retrieval performance.
- Automation: algorithm quality decides recovery speed.
- Dredging: fairway reliability protects schedule flexibility.
- Commercial intelligence: node signals improve investment timing.
The metrics worth watching before visible congestion appears
Not every metric is equally useful. Strong observation focuses on indicators that capture interaction between nodes.
Together, these metrics make logistics node dynamics easier to interpret as a leading signal rather than a post-event explanation.
Where attention should focus now
The most useful response is not simply adding more capacity. It is identifying where coordination losses destroy existing capacity.
- Map logistics node dynamics across berth, yard, gate, and channel conditions.
- Compare peak-hour performance with average daily figures.
- Test whether automation systems recover quickly after schedule disruption.
- Link dredging maintenance data with berth planning scenarios.
- Review whether equipment bottlenecks are mechanical or algorithmic.
- Track inland handoff reliability, not only quay productivity.
A practical way to respond to emerging bottlenecks
A sound response starts with visibility, then moves to prioritization, and finally to coordinated correction.
- Build a node-level dashboard using operational and scheduling data.
- Separate recurring friction from event-driven disruption.
- Rank pressure points by network impact, not local inconvenience.
- Adjust dispatch rules, stack policies, or berth windows first.
- Invest in added gear or dredging support where structural limits remain.
This sequence keeps logistics node dynamics tied to decisions that improve throughput, resilience, and schedule credibility.
In a volatile trade environment, the ports that perform best will not be those reacting fastest to visible congestion.
They will be the ones reading logistics node dynamics early, understanding how bottlenecks travel, and correcting the system before flow breaks down.
For deeper monitoring of terminal gear, automation signals, fairway constraints, and evolving maritime trade pressure, PS-Nexus provides the intelligence framework needed to turn scattered node data into actionable judgment.
Related News
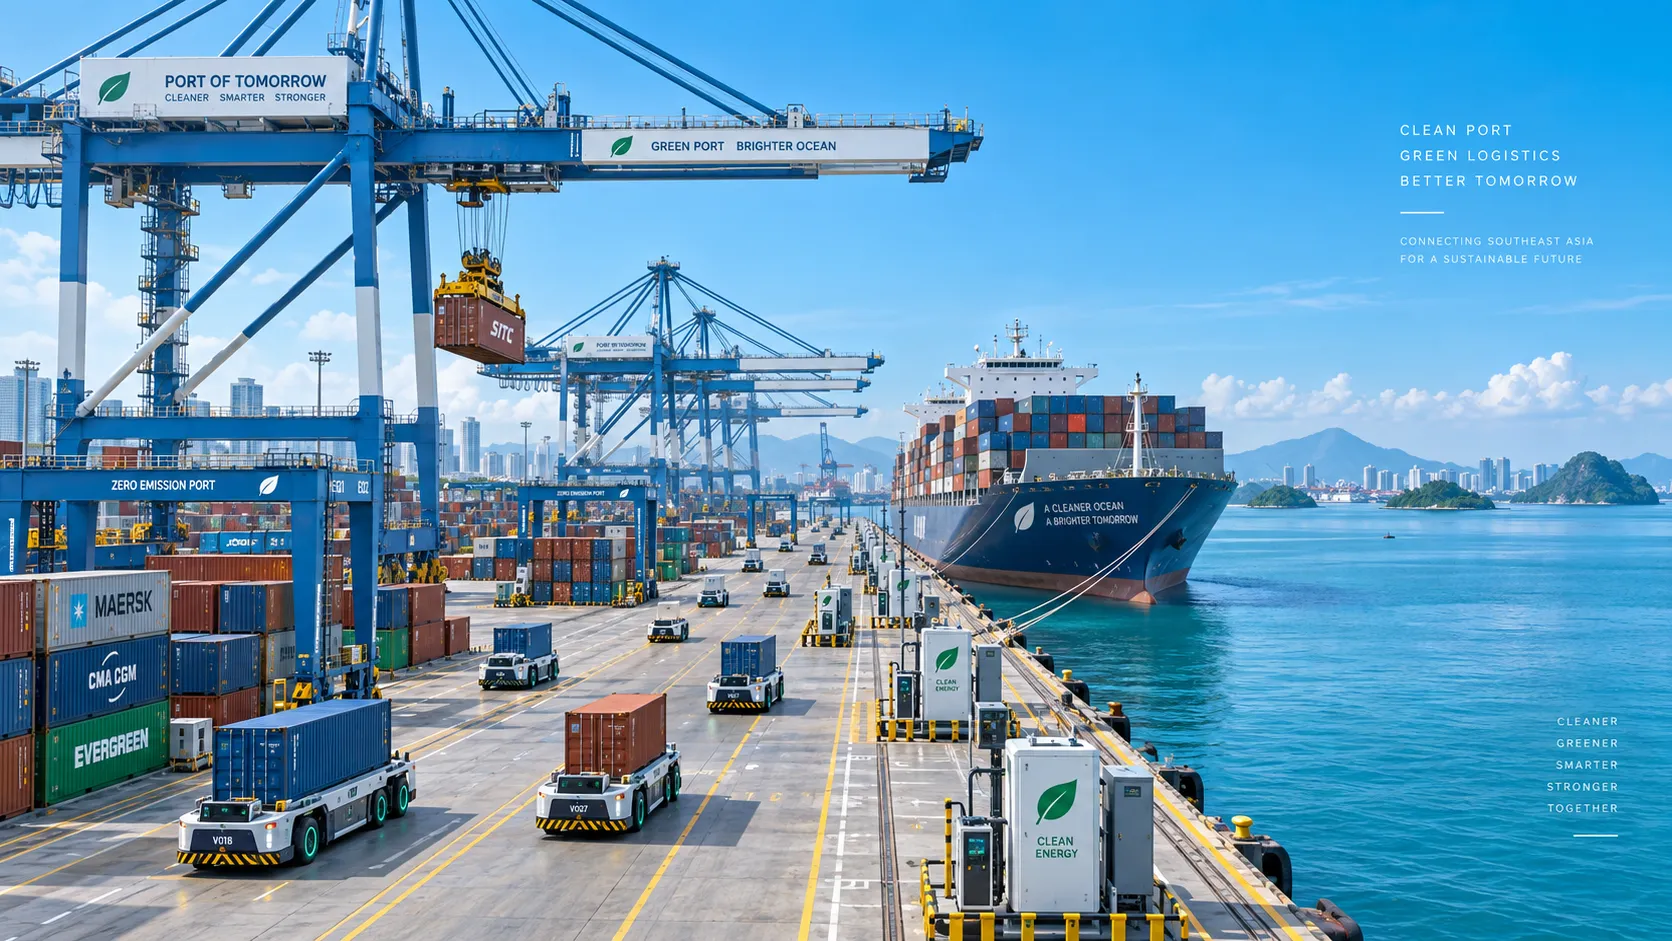
Smart Port Systems in Southeast Asia: Investment Priorities and Adoption Barriers
Smart port systems Southeast Asia: discover investment priorities, adoption barriers, and practical steps to build resilient, connected, high-performing terminals.
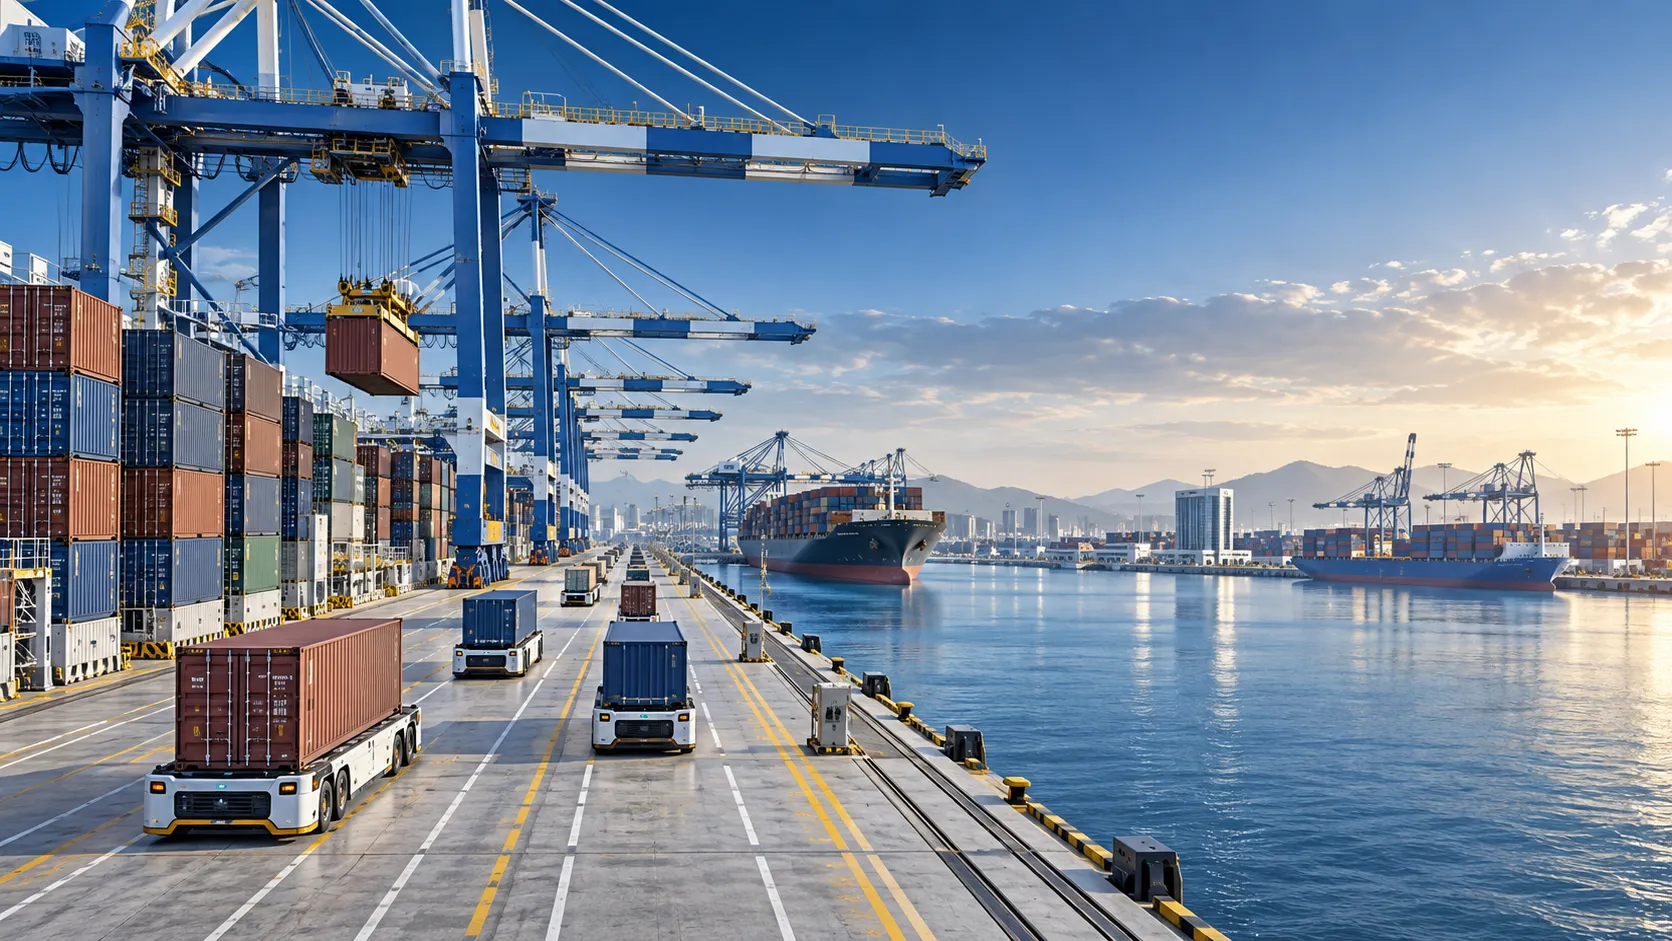
How to Evaluate Terminal Efficiency Solution Suppliers for High-Throughput Operations
Choose a terminal efficiency solutions supplier with confidence. Explore proven criteria for throughput, integration, lifecycle cost, safety, and reliable delivery.
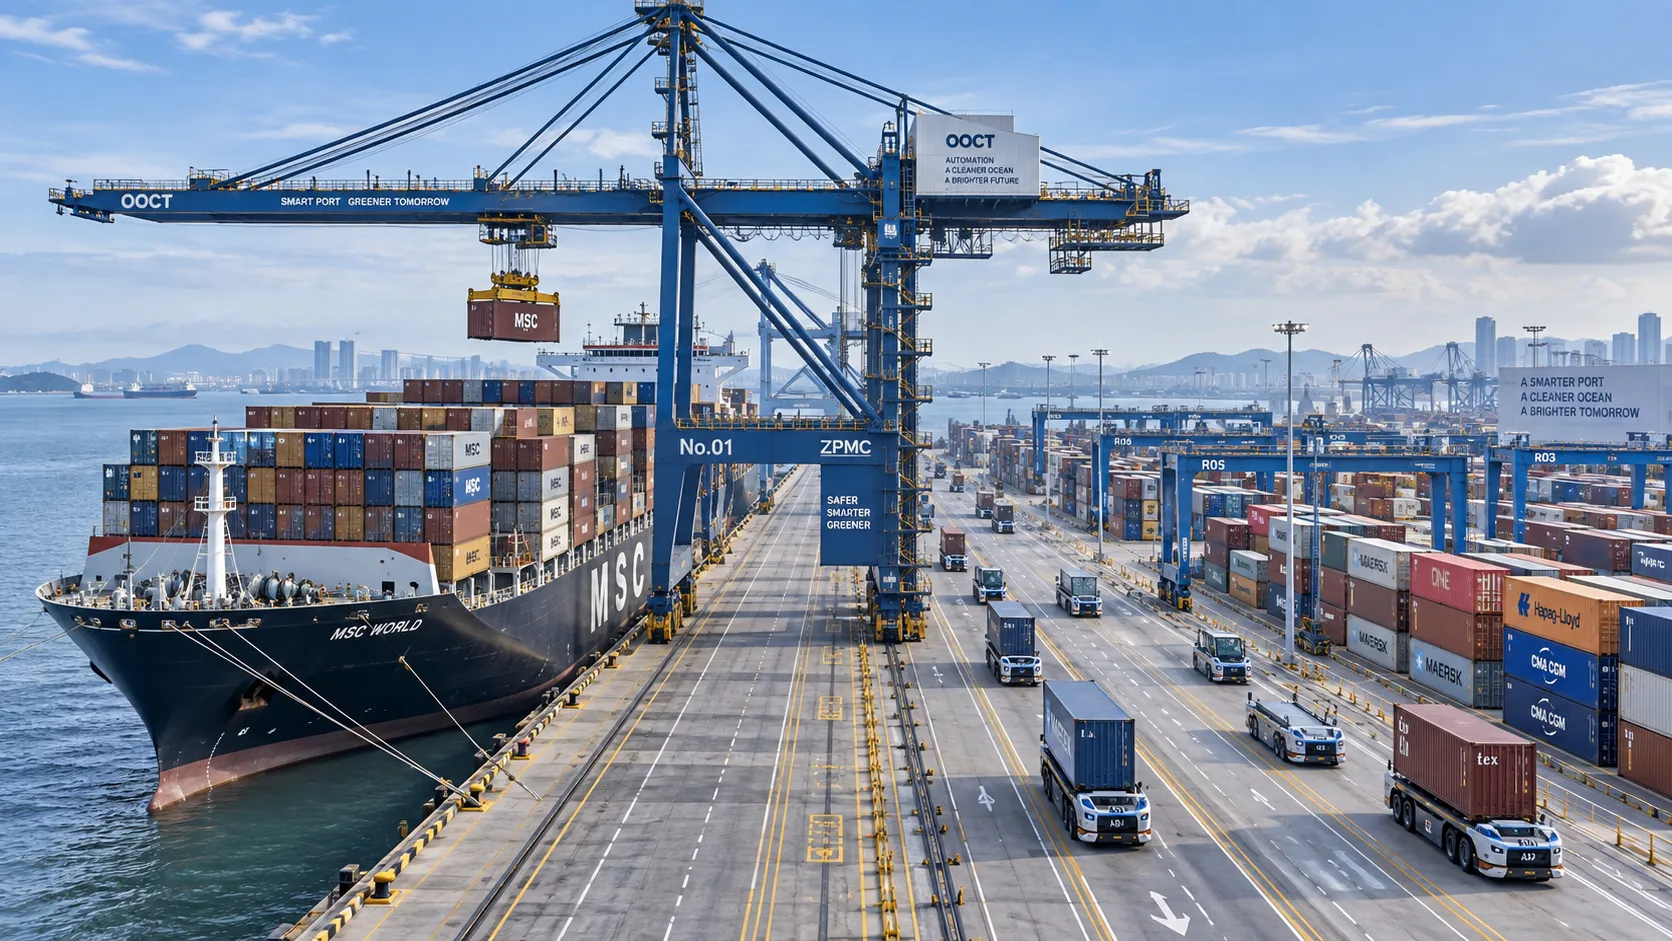
How to Specify a Quay Crane for Container Terminals by Vessel Size and Throughput?
Quay crane for container terminals: learn how to match outreach, lift height, capacity, automation, and cycle performance to vessel size and throughput goals.
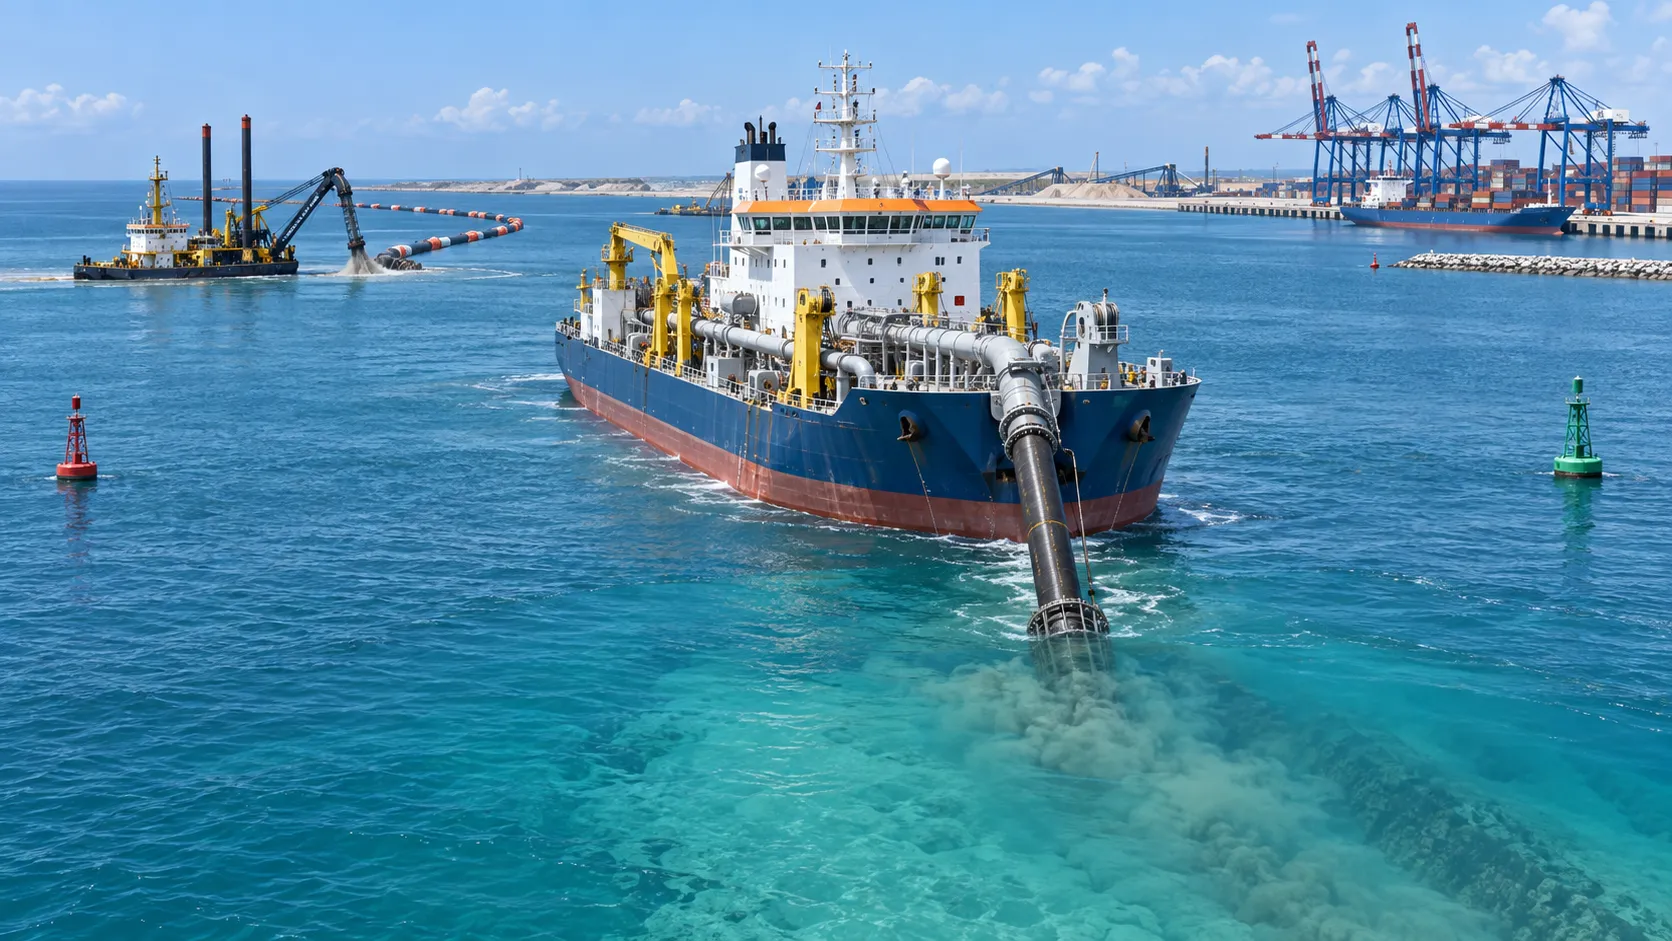
What Dredging Equipment Is Needed for Channel Deepening?
What dredging equipment is needed for channel deepening? Explore dredgers, pipelines, survey tools, and planning strategies for safer, more efficient port access.
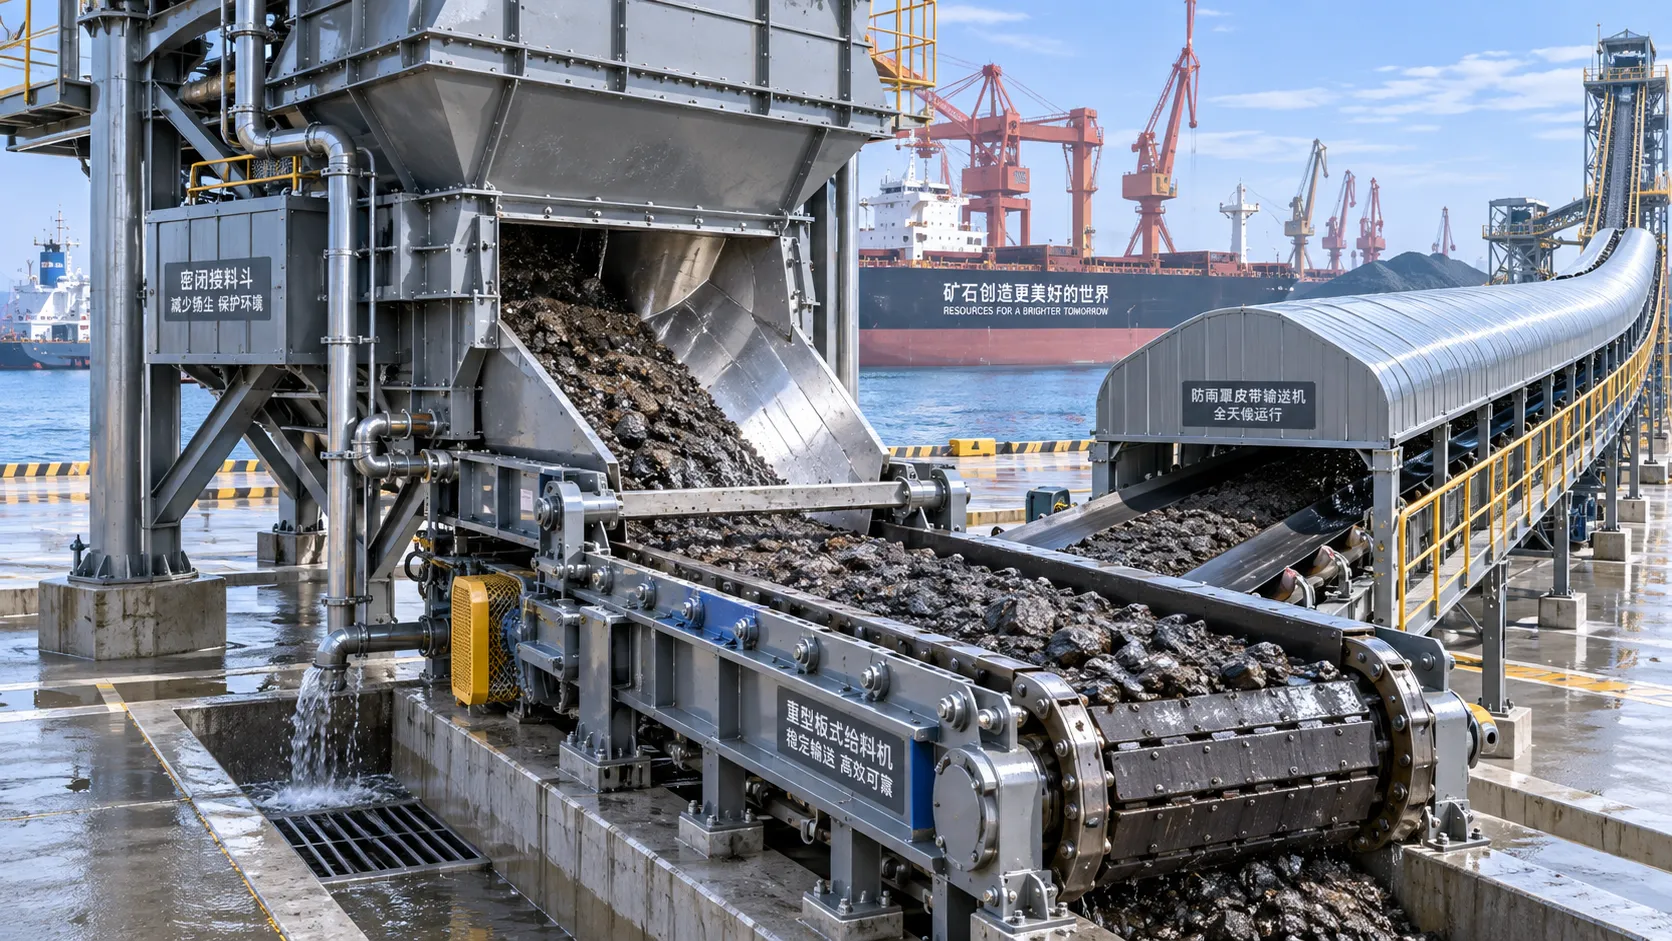
Which Bulk Handling Equipment Suits High-Moisture Cargo?
Which bulk handling equipment suits high-moisture cargo? Compare belt, apron, screw, drag, and slurry systems for reliable flow, less carryback, and higher terminal uptime.
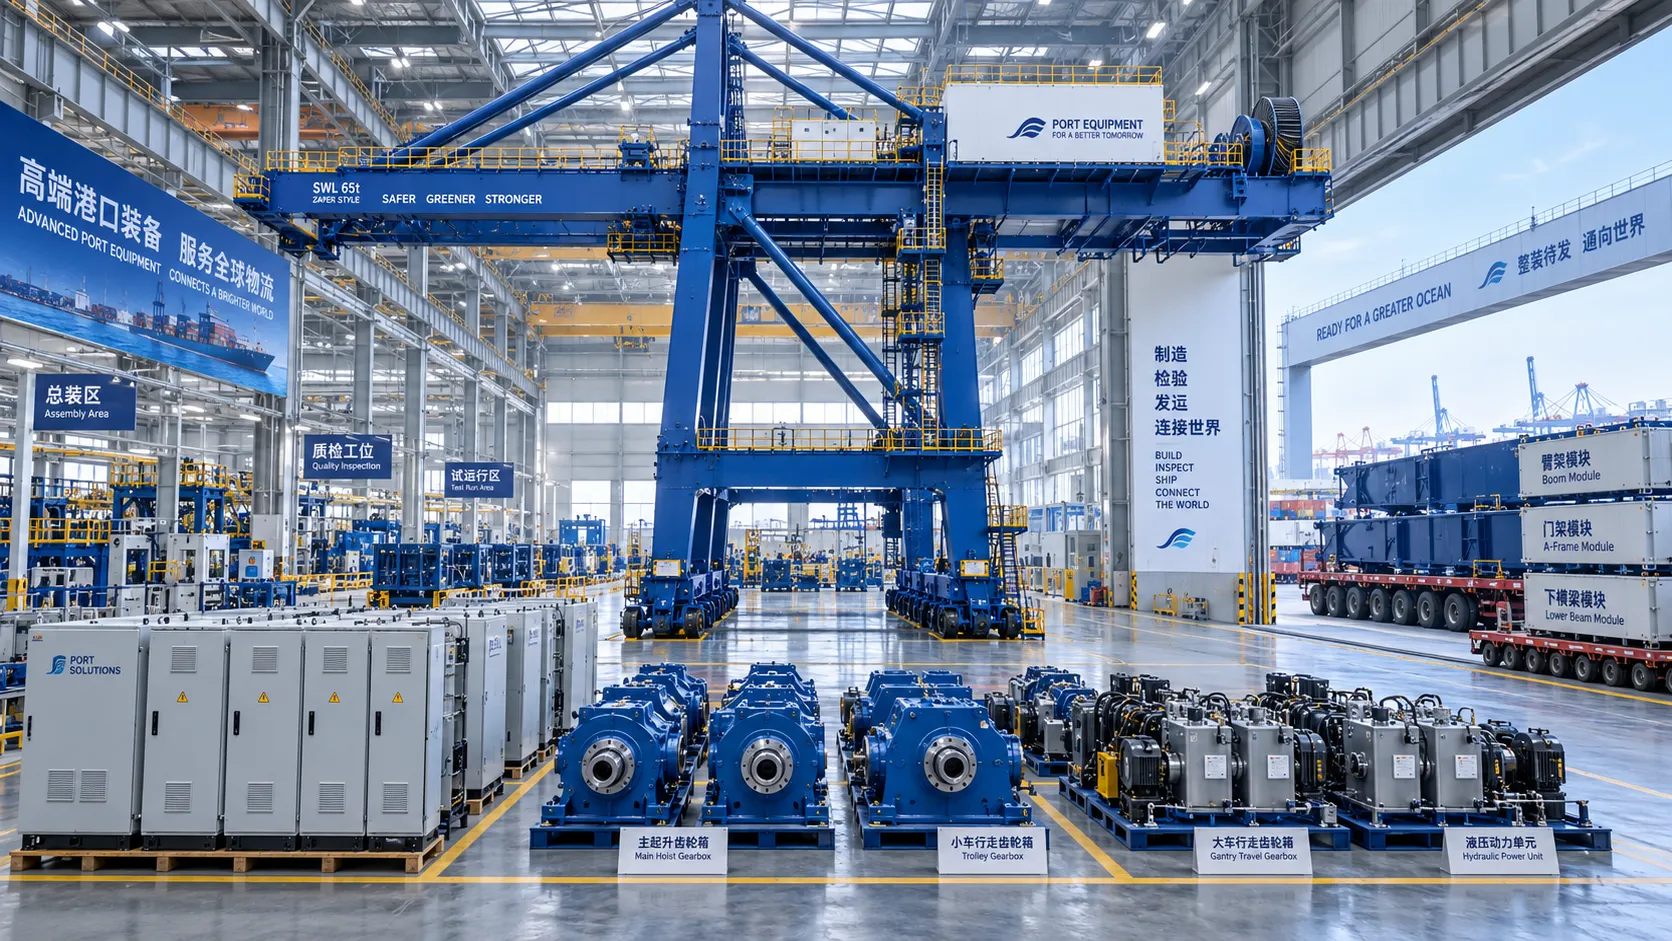
How Can Port Equipment Lead-Time Risk Be Managed?
How can port equipment lead-time risk be managed? Explore practical strategies to control critical paths, suppliers, transport, site readiness, and commissioning delays.
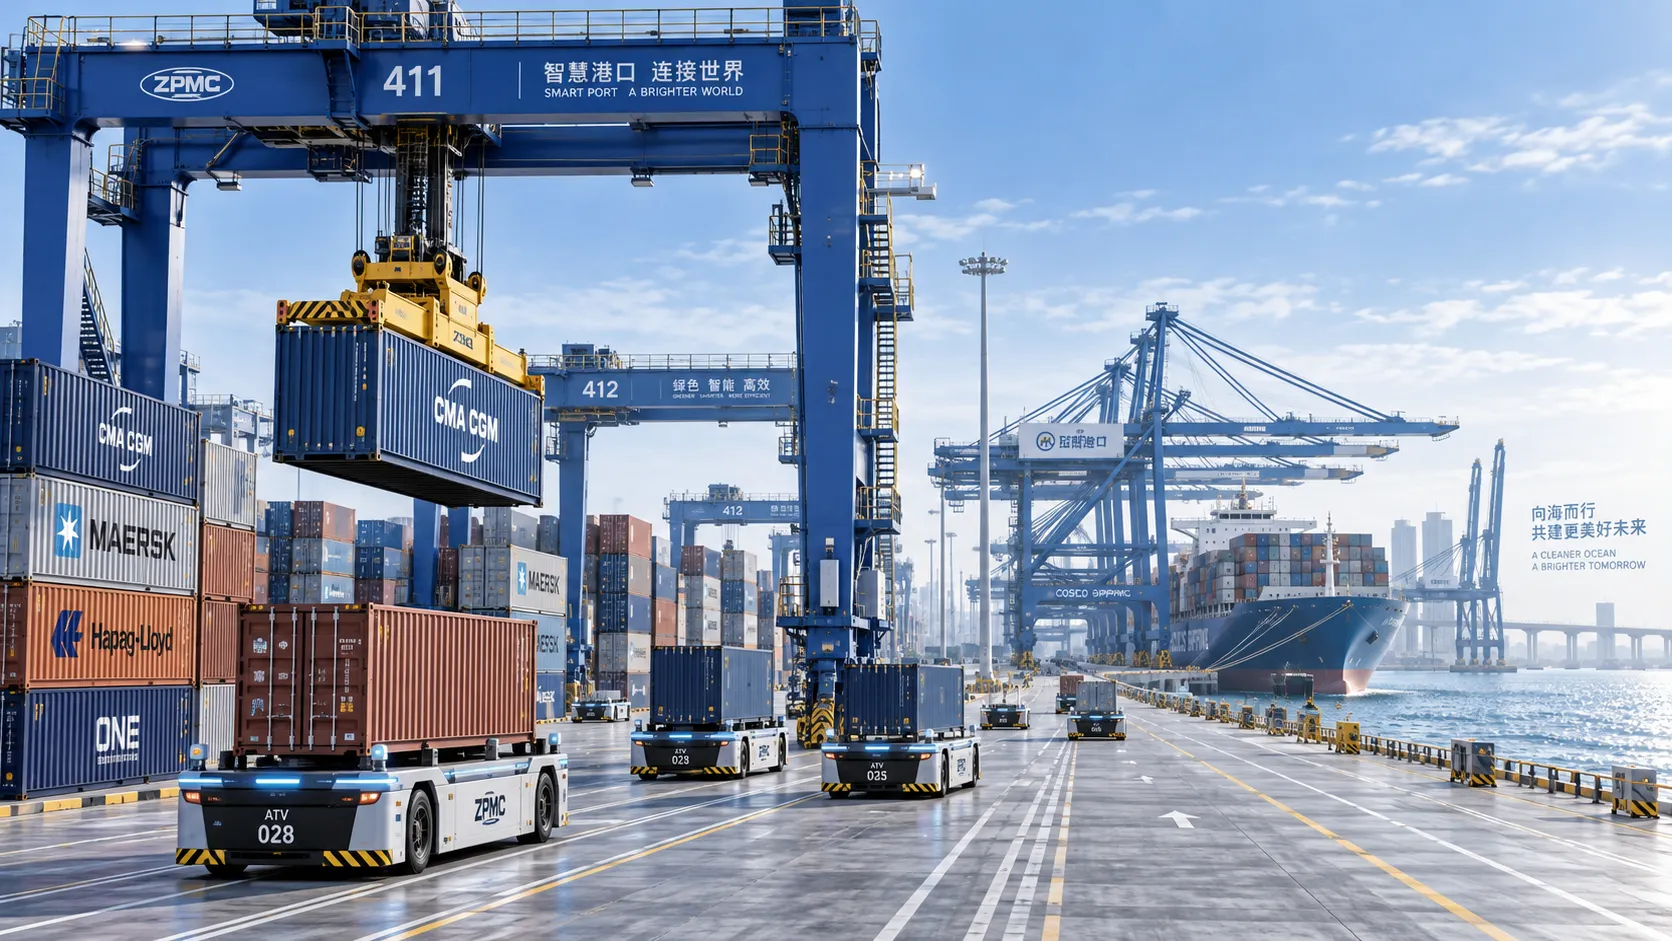
Terminal Automation Technologies That Raise Container Throughput Without Yard Disruption
Terminal automation technology that increases container throughput without disrupting yard flow. Explore smarter integration, resilient workflows, and phased deployment strategies.
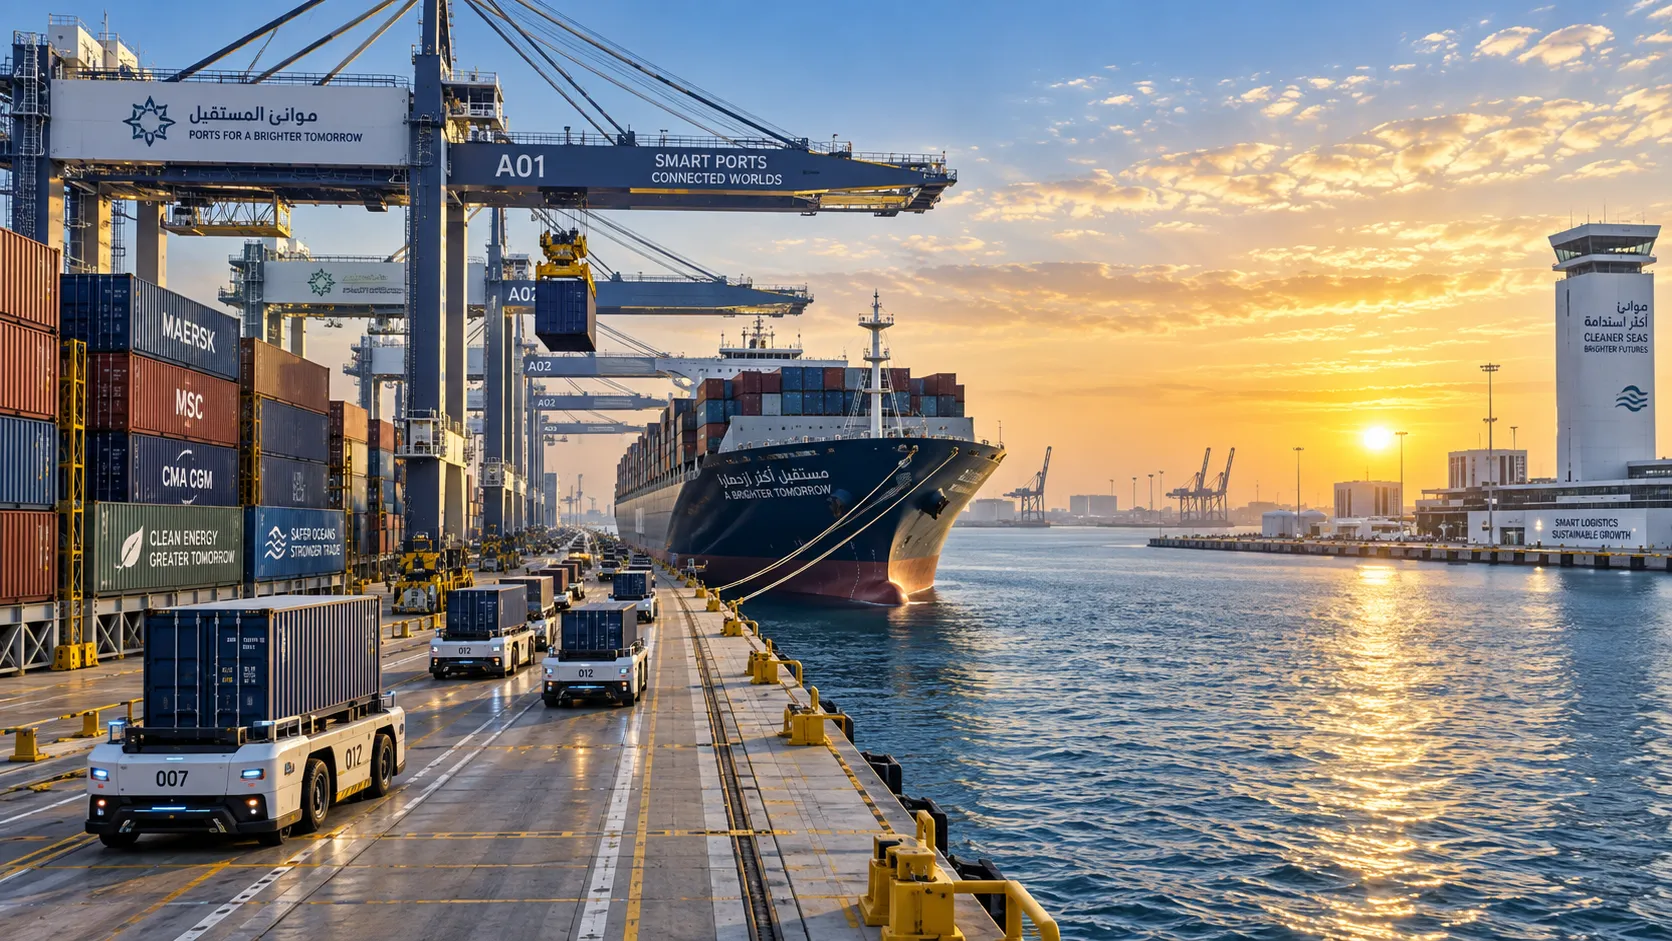
Middle East Port Automation: Key Market Drivers, Projects, and Investment Risks
Port automation systems Middle East: explore market drivers, flagship projects, integration challenges, and investment risks shaping smarter, resilient terminals.
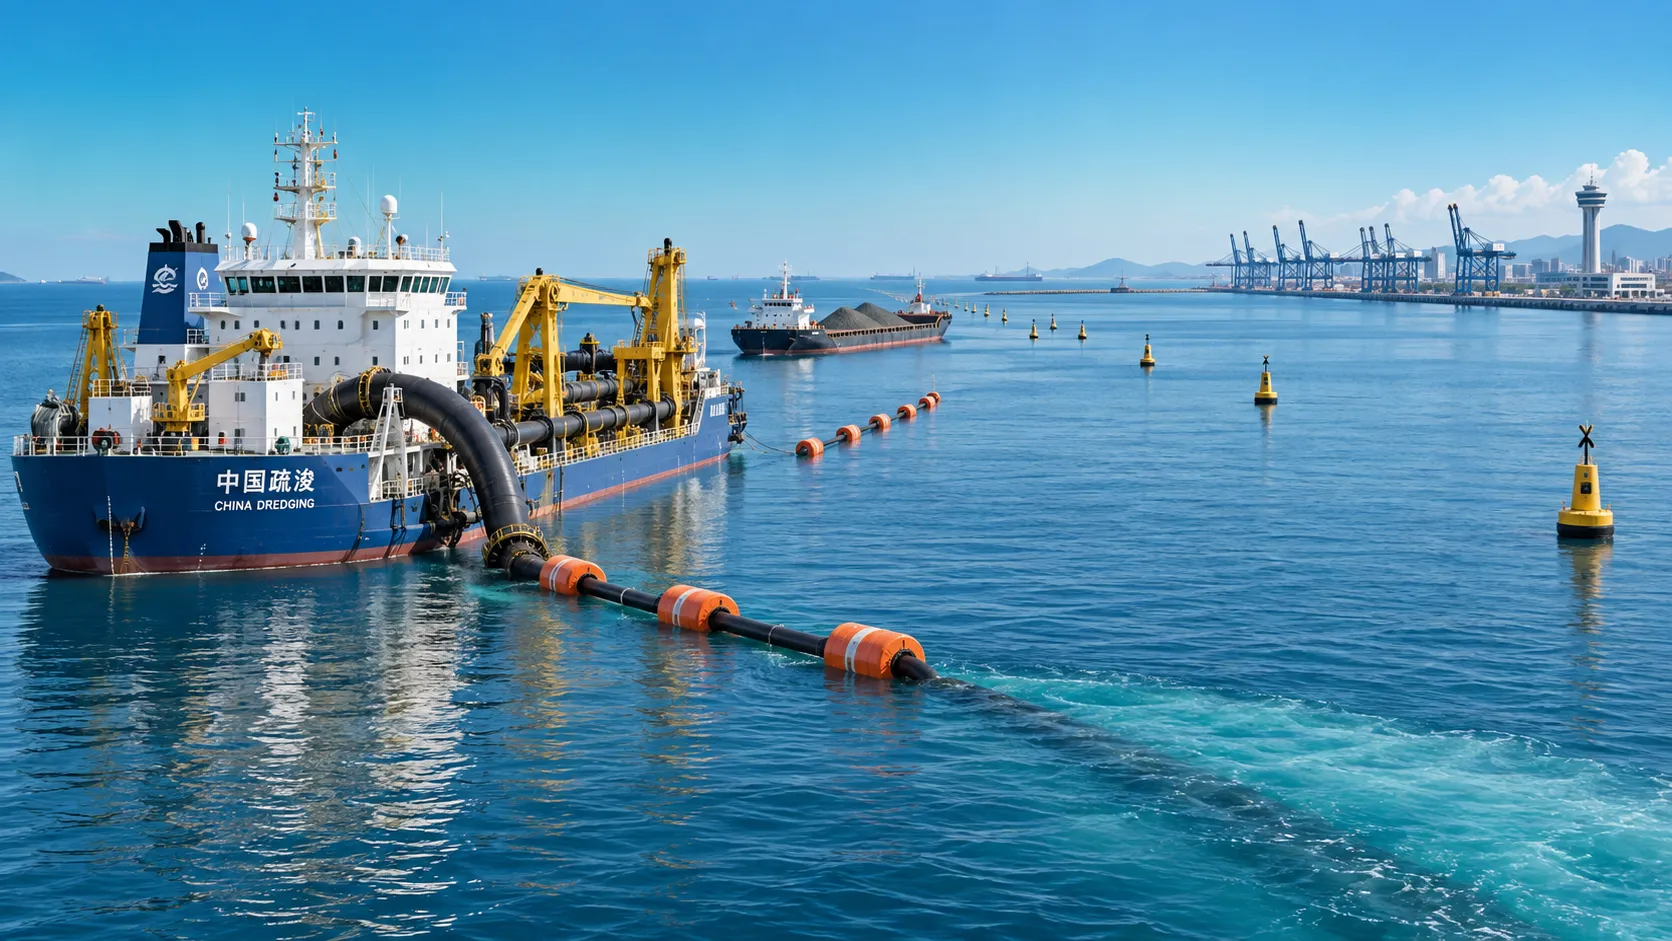
Planning Offshore Dredging Operations: Key Risks, Methods, and Project Controls
Offshore dredging operations demand smart planning. Explore key risks, proven methods, environmental controls, and project strategies for reliable delivery.