Related News
- 00
0000-00
What Should a Port Capacity Plan Measure Before a New Berth or Crane Investment? - 00
0000-00
Work Vessel Procurement Risks: Verifying Build Scope and Delivery Terms - 00
0000-00
What Port Insights Data Reveals About Vessel Delays and Berth Utilization - 00
0000-00
Shipping Logistics Intelligence: Turning ETA Data Into Exception Management - 00
0000-00
How Do Maritime Disruptions Affect Port Equipment Procurement?
What Port Insights Data Reveals About Vessel Delays and Berth Utilization
Port insights data is most useful when it explains the chain of events behind a late departure or an occupied berth, rather than simply reporting that a vessel arrived late. A vessel can miss its schedule because it reached the anchorage behind plan, waited for a berth, lacked a pilot window, encountered yard congestion, or lost working time after berthing. These are different operational problems, and treating them as one “delay” leads to poor decisions.
For terminal operators, carriers, cargo owners, and market researchers, the practical value of port intelligence lies in separating those causes. Arrival patterns, berth occupancy, port stay, crane activity, yard conditions, weather disruptions, and equipment availability can reveal whether a port is constrained by marine access, berth capacity, handling productivity, or the flow of containers beyond the quay.
Delay is not one metric
A published vessel arrival time or departure time is only an outcome. To understand operational performance, the vessel call should be broken into stages:
- Arrival at the port area or anchorage
- Waiting time before berth assignment
- Time alongside the berth
- Active cargo-handling time
- Non-working time while alongside
- Departure clearance and sailing time
This distinction matters because the apparent problem can sit in the wrong place. A vessel that waits offshore for a long period points toward berth availability, scheduling conflicts, tidal restrictions, pilotage capacity, or a disrupted arrival sequence. A vessel that berths promptly but remains alongside for longer than planned suggests a different set of constraints: crane outages, slow hatch changes, labor availability, stowage complications, yard blockage, truck or rail interface issues, or delayed cargo documentation.
Port insights data should therefore be read as a timeline, not a single service score. A terminal may look inefficient if its average port stay is high, yet the main source of delay may have occurred before the vessel reached the berth. Conversely, low anchorage waiting does not prove that berth operations are healthy if vessels occupy berths for unusually long periods.
What berth utilization actually tells you
Berth utilization generally describes how much of a berth’s available time is occupied by vessels. At first glance, high utilization seems desirable: it suggests assets are being used rather than sitting idle. In port operations, however, a berth that is consistently close to full occupancy can become fragile. Small disruptions then have no buffer in which to be absorbed.
A late inbound vessel, a longer-than-planned cargo operation, a crane breakdown, adverse weather, or a change in vessel priority can push the next call into waiting time. Once that happens repeatedly, the berth schedule becomes reactive. The resulting congestion may be visible in vessel queues, missed departure windows, bunching of arrivals, and increasingly unreliable estimated times of berth.
Low utilization is not automatically a sign of spare commercial opportunity either. It can reflect seasonal cargo patterns, restricted berth suitability, draft limitations, maintenance windows, or a terminal that has deliberately preserved capacity for variable calls. The useful question is not “Is berth utilization high or low?” but “Is the observed utilization compatible with predictable vessel service for this cargo mix and call pattern?”
Utilization must also be interpreted at berth level. Aggregating all berths can hide a serious constraint. A terminal may have open capacity overall while its deep-water berth, reefer-capable berth, bulk loading point, or berth equipped for a particular vessel class is oversubscribed.
Reading the relationship between queues and berth occupancy
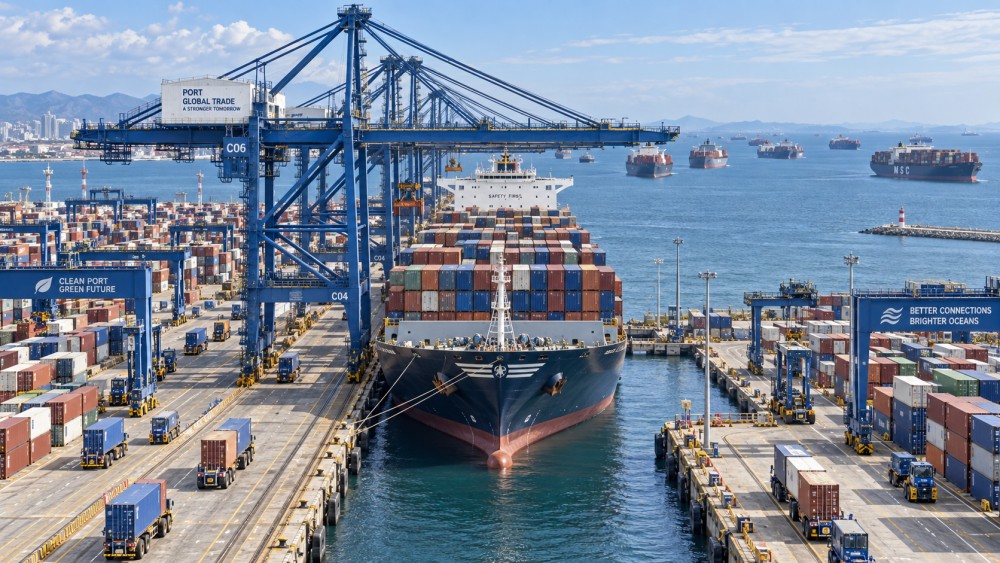
The combination of anchorage waiting and berth utilization provides a stronger diagnosis than either metric alone. It helps researchers distinguish a structural capacity issue from an isolated operational event.
One common mistake is to infer berth scarcity from a queue alone. A queue can form even when a berth is physically vacant if the berth cannot accept the vessel safely or operationally at that time. A container vessel may need compatible cranes and a suitable window in the yard plan. A bulk carrier may require cargo readiness and loading equipment. Tanker and project-cargo calls have their own clearance and handling constraints. Port intelligence becomes meaningful when it preserves these operational distinctions.
Why arrival reliability changes the berth picture
Berth plans are often built around expected arrival sequences. When ships arrive broadly as planned, a terminal can arrange crane allocations, yard blocks, labor shifts, service providers, and onward transport with reasonable confidence. When arrivals become volatile, even a terminal with theoretical capacity can lose productive time.
For example, several late vessels may arrive within a narrow period after a weather disruption or congestion at an upstream port. The terminal then faces a choice: hold vessels in sequence, resequence calls to use available space, reduce resources per ship, or extend working windows. Each choice may protect one part of the operation while shifting delay elsewhere. A berth may appear fully utilized in the data, but the underlying cause is arrival bunching rather than a permanent lack of infrastructure.
This is why researchers should compare planned, estimated, and actual arrival times over a meaningful operating period. Look for patterns rather than one difficult week. Are delays concentrated around particular services? Do they occur after calls at certain preceding ports? Are they linked to weather-sensitive seasons, tidal windows, or a repeated conflict between vessel schedules? The answer affects whether the response should be scheduling discipline, operational capacity, marine service coordination, or a change in network routing.
Time alongside needs to be split into productive and unproductive periods
A long berth stay is not necessarily poor performance. A large call with substantial cargo volume may legitimately require more working time than a smaller vessel. The better comparison is between the planned operation and the actual sequence of work, while taking account of vessel size, cargo type, exchange volume, and handling configuration.
Port insights data is especially valuable when it can distinguish productive work from time lost while the vessel remains alongside. Productive handling time reflects the pace of loading or discharge. Non-productive time may reflect equipment failures, weather stops, labor interruptions, inspection holds, yard reshuffles, lashing activity, delayed boxes, or a lack of available transport capacity to clear cargo from the terminal.
This division prevents an overly simple conclusion such as “more cranes will solve the delay.” Additional quay-crane capacity may help when ship-side handling is the constraint. It does little when the yard is saturated, automated guided vehicles cannot circulate effectively, containers cannot be stacked in the planned positions, or a downstream rail connection is blocked. In automated terminals, the relationship is even tighter: quay cranes, horizontal transport, yard cranes, control software, and charging or maintenance availability must work as one system.
Equipment data explains why nominal capacity is not usable capacity
Terminal capacity is often described in terms of installed equipment or berth length. Operational capacity is narrower. It is the capacity that can be delivered under current labor, maintenance, yard, marine, and control-system conditions.
A quay crane may be installed but unavailable for planned work. A yard crane may be working but assigned to a congested block. Bulk handling machinery may be ready while cargo supply or storage capacity is constrained. Dredging conditions or channel maintenance can influence draft access, changing which vessels can use which berth and when. These links explain why a terminal’s operating picture cannot be understood from vessel movement data alone.
For research into terminal modernization, equipment data should be connected to the delay pattern it is intended to address. Remote-control capability, automated container handling, berth-management software, and condition monitoring each solve different problems. They are not interchangeable upgrades. A system that improves dispatching may reduce delays caused by poor resource coordination, but it will not create physical yard space. Extra lifting equipment may raise handling capacity, but it may not improve schedule reliability if inbound vessel arrivals remain highly variable.
PS-Nexus follows these relationships across terminal gear, automated handling, port control systems, and dredging engineering. That broader view is useful because vessel delays are rarely explained by one machine or one dashboard. They emerge from the interaction between marine access, berth planning, cargo flow, equipment condition, and the scheduling logic that connects them.
Use trends and distributions, not only averages
An average waiting time can conceal a port that serves most vessels smoothly but produces severe delays for a smaller group. That group may be commercially important: a particular shipping alliance, deep-draft vessels, refrigerated cargo calls, bulk carriers waiting for stockpile access, or ships arriving outside preferred working windows.
When reviewing port insights data, examine the spread of results. A useful dataset can show median and upper-range waiting periods, repeated delay windows, variation by berth or vessel segment, and the difference between scheduled and actual turnaround. It should also preserve event timestamps so that a researcher can reconstruct what happened during a disruption.
Short data windows create another problem. A few days of empty berths do not establish excess capacity, just as a single congestion event does not prove that a port is structurally overloaded. Compare like with like: similar vessel types, similar call purposes, comparable seasons, and equivalent berth restrictions. The objective is to identify recurring operating conditions, not to force every call into one benchmark.
Questions that make port intelligence actionable
Before using a port dataset for a routing, investment, procurement, or market assessment, clarify the operating question it must answer. Broad data collection becomes more useful when it is tied to a specific decision.
- Is the concern delay before berthing, delay during cargo work, or late departure after handling?
- Which berth types and vessel classes are relevant, rather than which port averages are available?
- Does the dataset record actual events, estimates, or both?
- Can it identify equipment, weather, marine-access, yard, and scheduling disruptions separately?
- Does it show recurring patterns by day, service string, season, or upstream port call?
- Can berth occupancy be linked to cargo operations and landside flow, rather than treated as a standalone figure?
These questions also define the limits of the analysis. Public vessel tracking can indicate where ships wait and when they move, but it may not reveal the terminal-level reason for every lost hour. Internal operational data can provide more detail, yet it needs consistent event definitions to be comparable across shifts, terminals, or ports. The strongest interpretation combines movement visibility with operational context.
From visibility to a better decision
Vessel delay and berth utilization should not be treated as competing measures. Together, they show whether a port is absorbing variability or passing it down the supply chain. Rising queues with busy compatible berths point toward a capacity or scheduling problem. Long stays alongside point toward execution or cargo-flow constraints. Irregular arrival patterns may show that the berth plan is being disrupted before the vessel reaches port.
For a researcher, the next useful step is to map the vessel call timeline, identify the repeated point of lost time, and then test that explanation against berth-specific utilization and operating conditions. That approach turns port intelligence from a collection of movements into evidence about where capacity is constrained, where resilience is weak, and which operational change is most likely to improve schedule reliability.
Related News
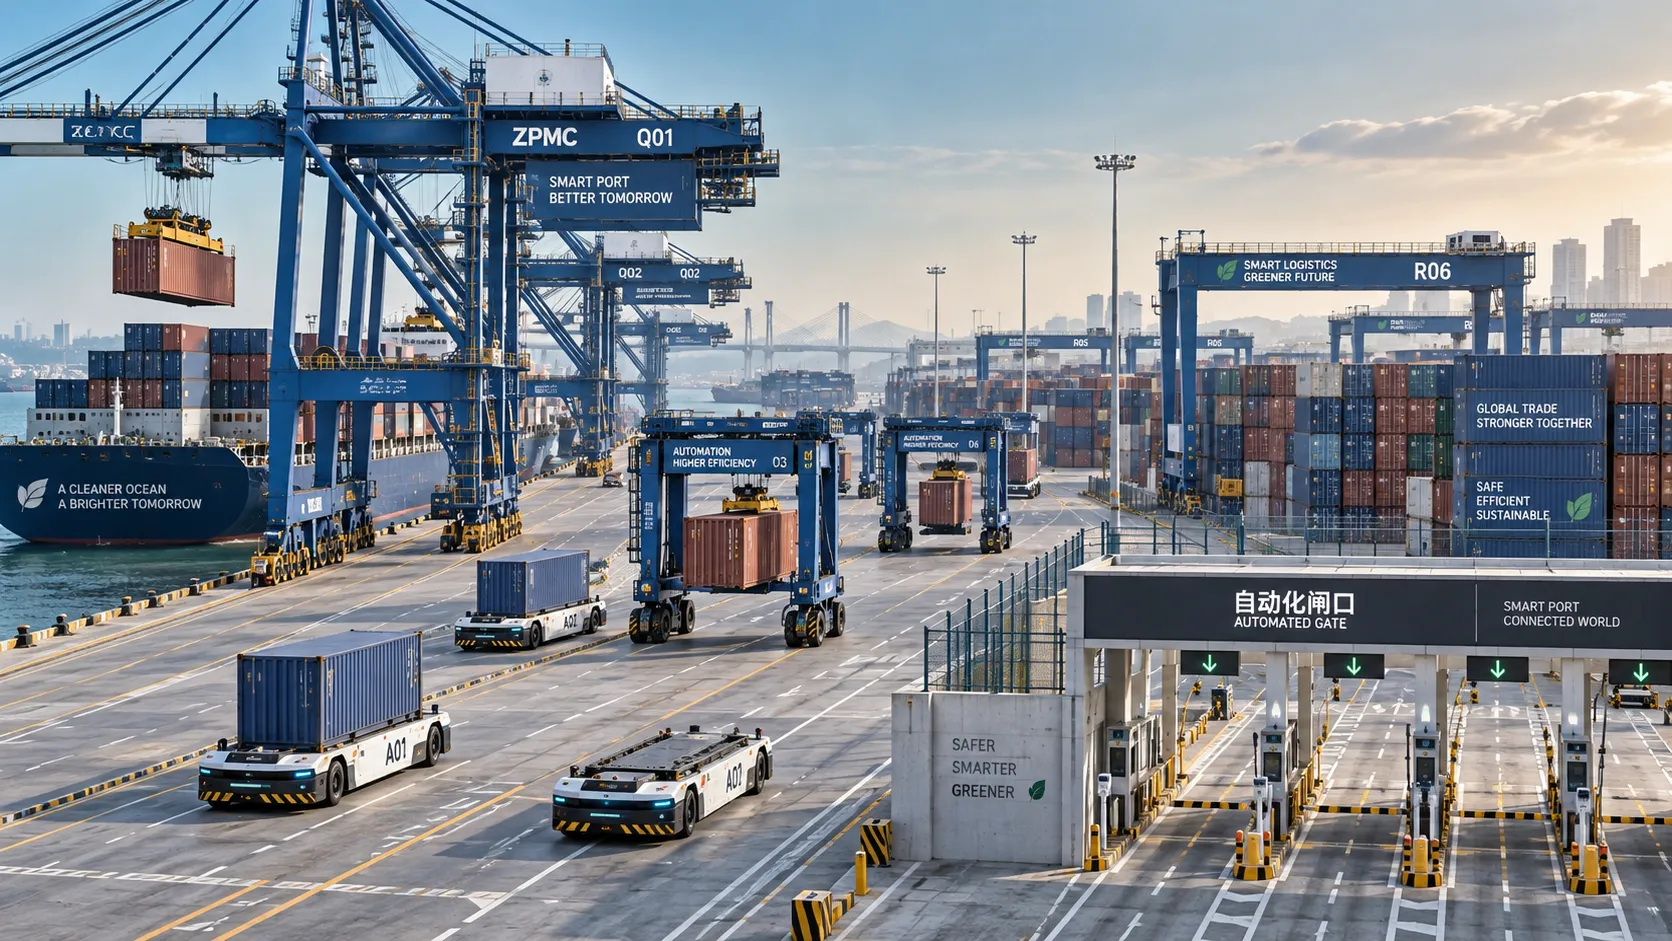
Automated Port Systems in Latin America: Investment Priorities for Container Terminals
Automated port systems Latin America: discover investment priorities for container terminals, from smart gates and remote cranes to resilient digital control layers.
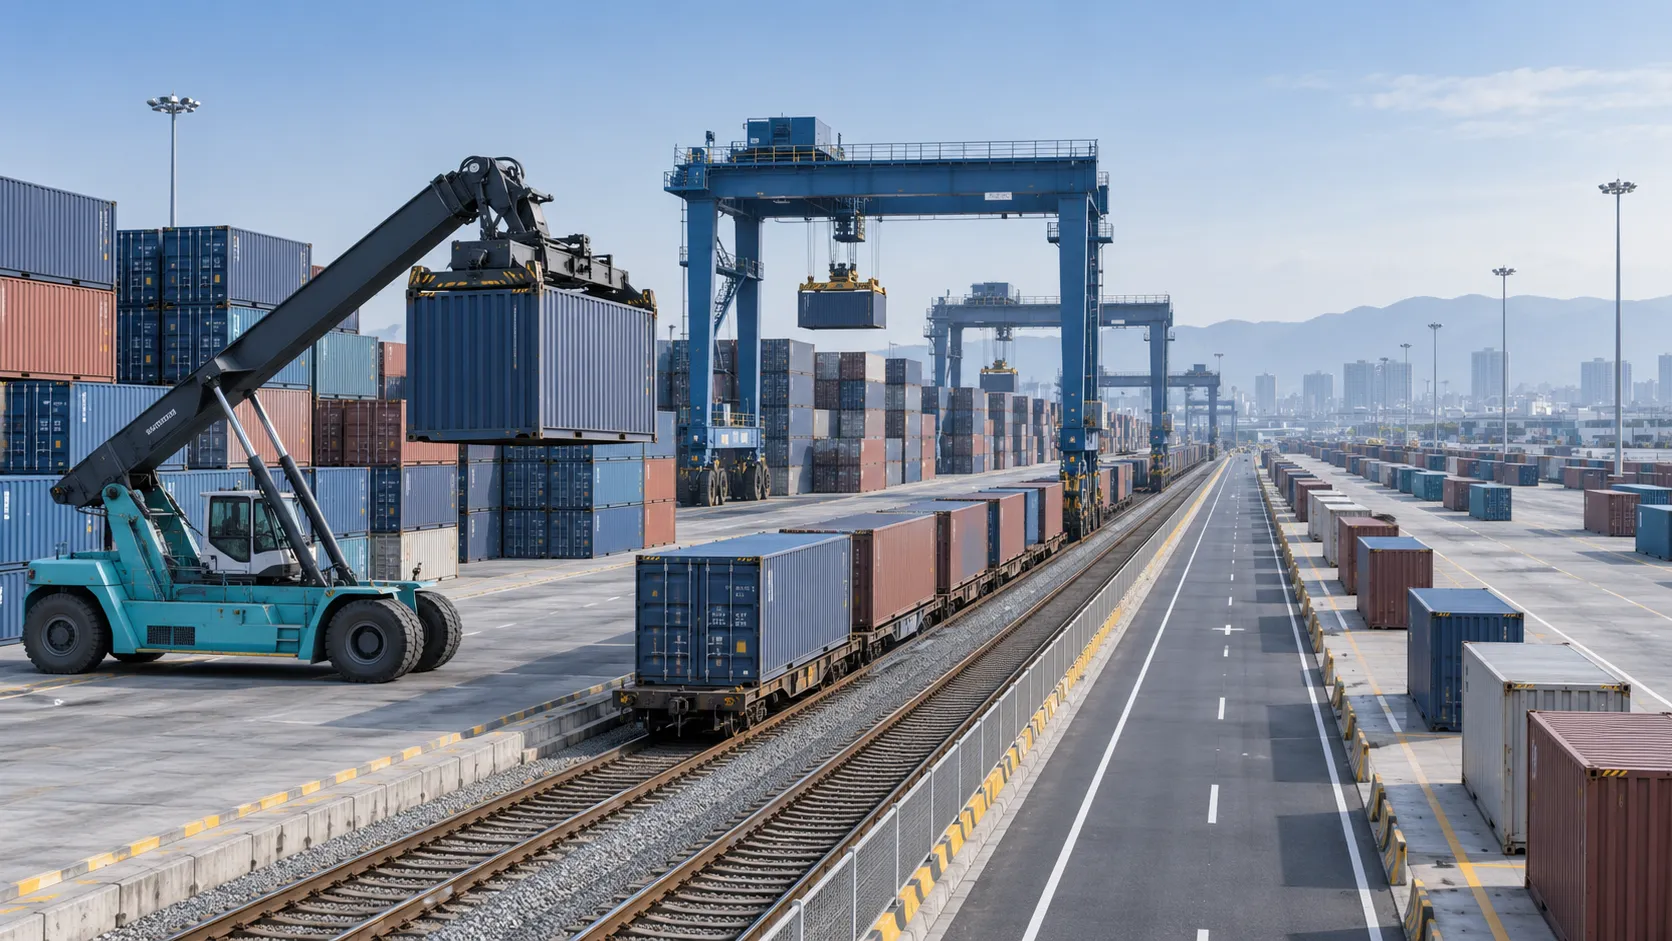
Selecting Intermodal Yard Equipment for Fast, Safe Container Transfers
Container handling equipment for intermodal yards: compare reach stackers, RTGs, automation, safety planning, and lifecycle costs to build faster, safer container flow.
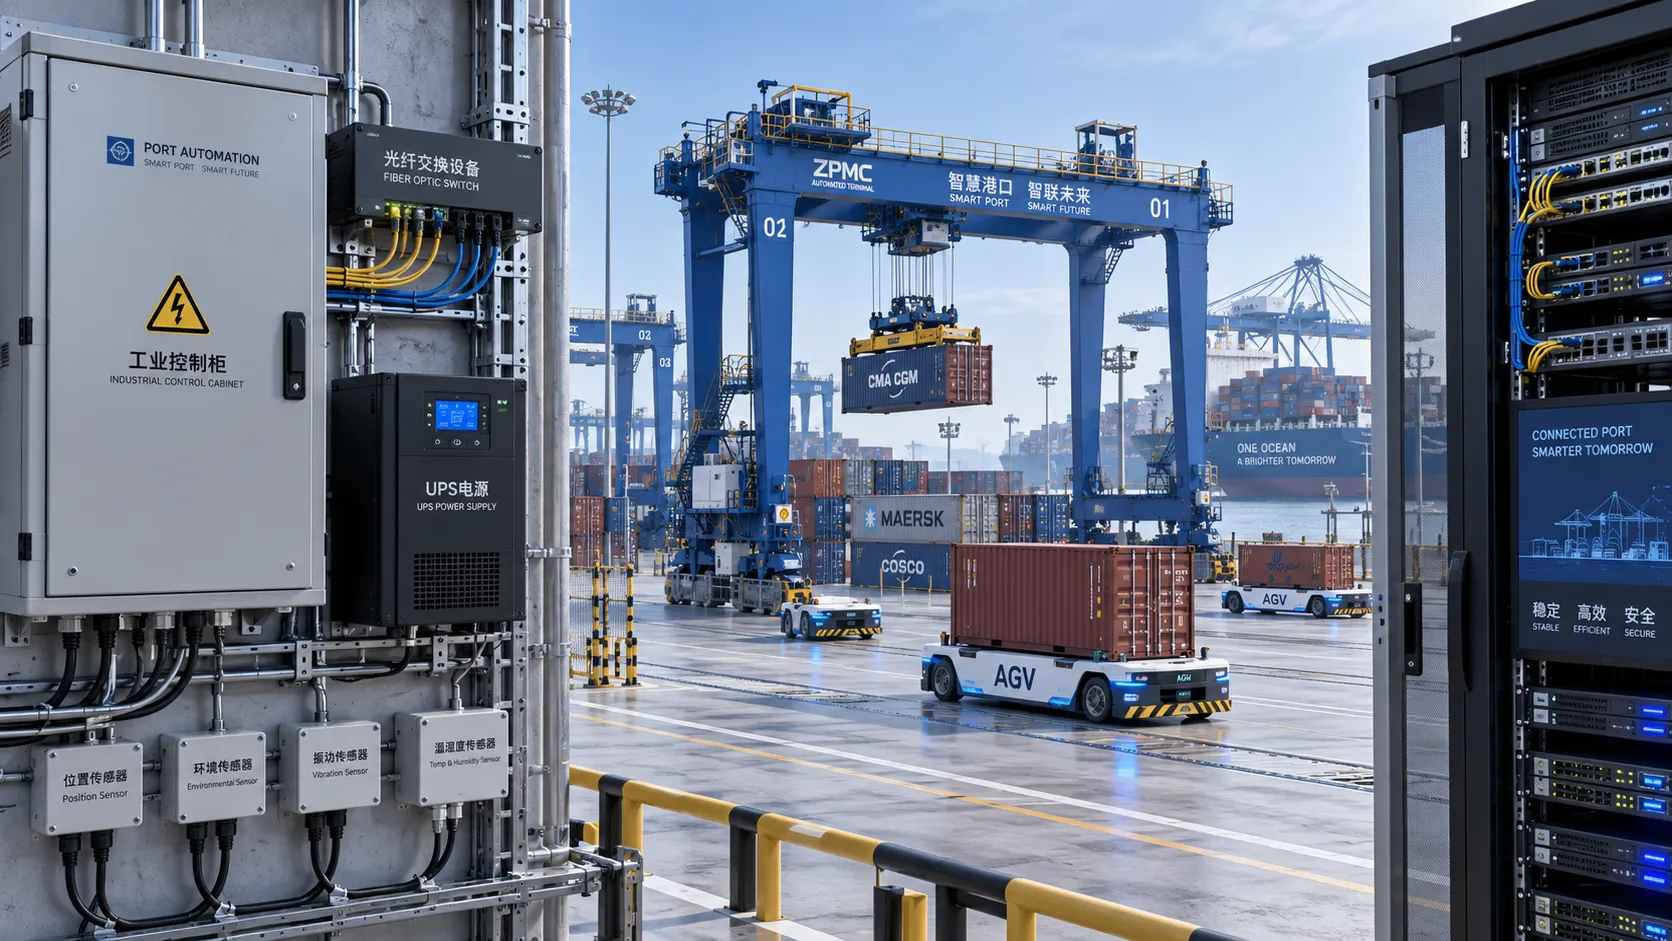
Terminal Control System Costs: Budgeting Hardware, Integration, and Lifecycle Support
Terminal control systems cost explained: budget hardware, integration, safety, cybersecurity, commissioning, and lifecycle support for resilient terminal operations.
Smart Operations in the Middle East: Where Industrial Investment Is Growing
Smart operations Middle East investment is reshaping ports, industrial corridors, and logistics networks through connected data, automation, resilience, and smarter asset performance.
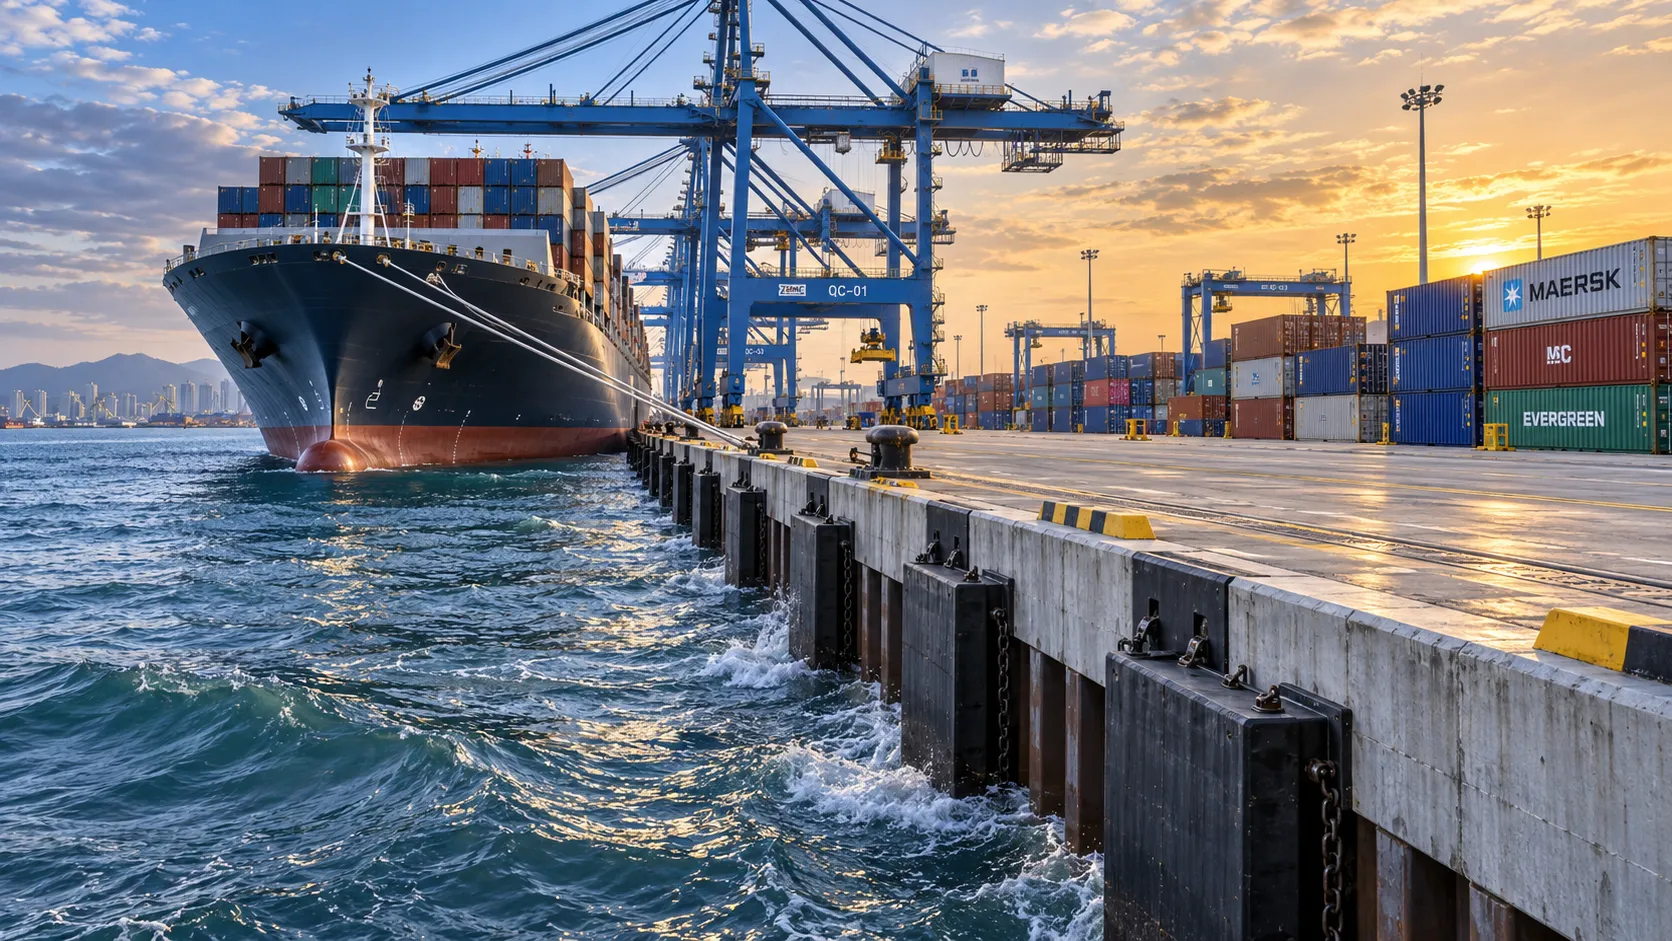
How to Select Harbor Structures for Quay Walls Under Berthing and Wave Loads
Harbor structure for quay wall selection: evaluate berthing energy, wave loads, soil conditions, durability, and lifecycle risk to build safer, adaptable terminals.
Selecting Smart Terminal Software for Multi-Site Field Service Operations
Smart terminal solutions software helps multi-site field service teams unify asset history, mobile maintenance, integrations, and reporting for safer, faster terminal operations.
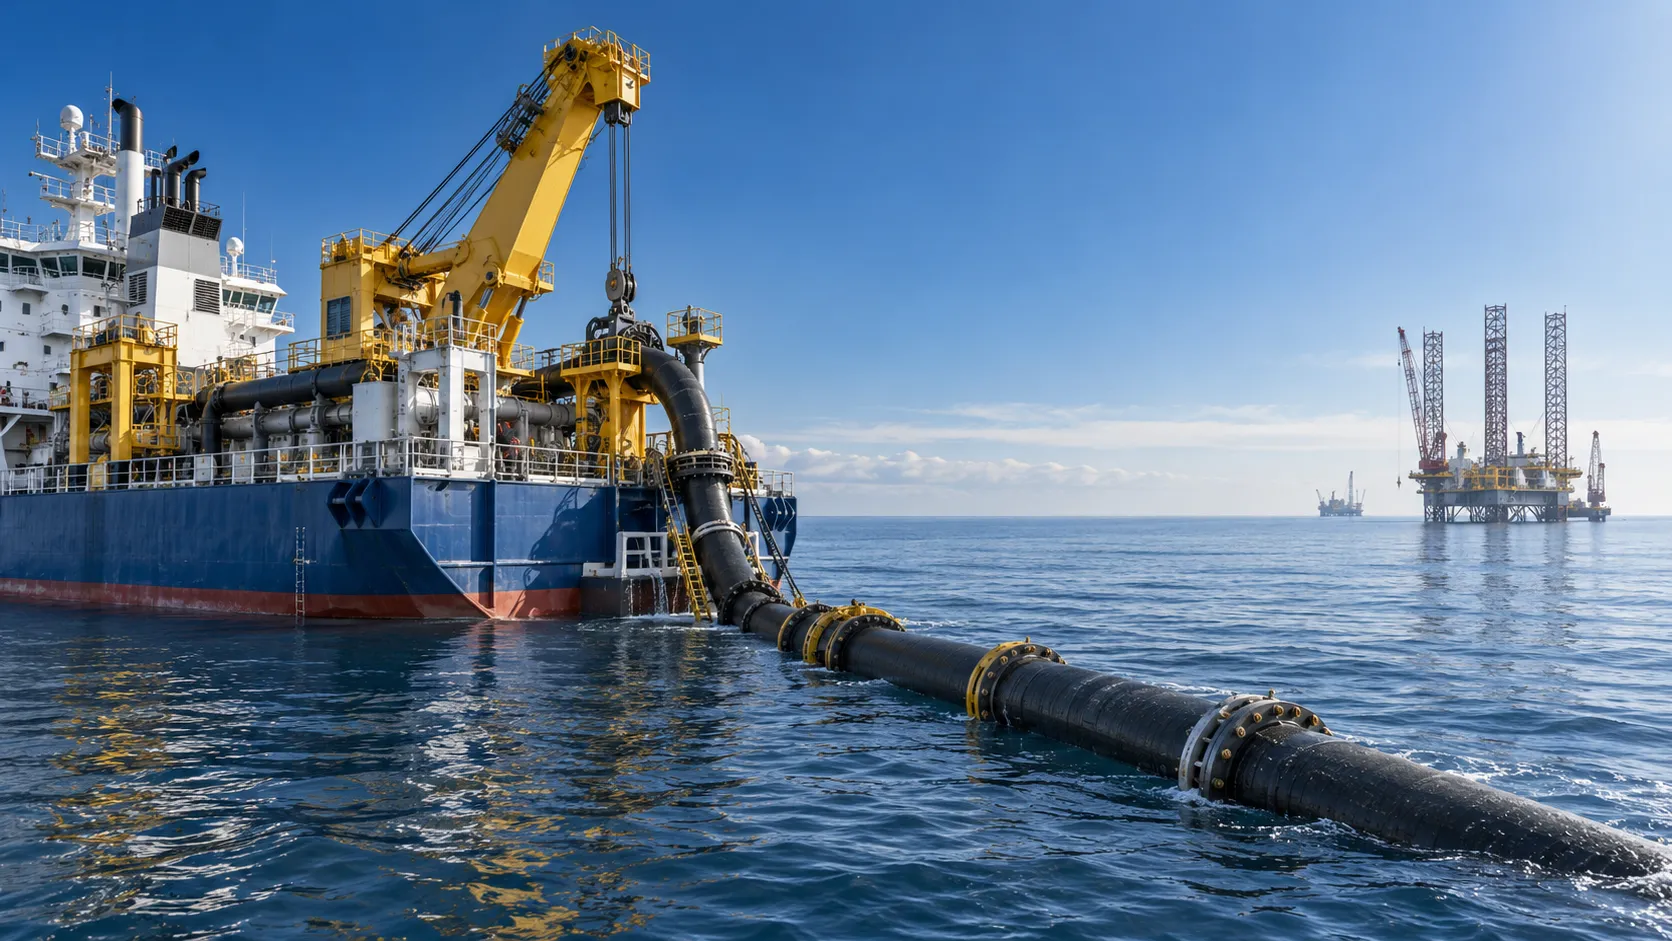
How to Specify Heavy-Duty Marine Engineering Equipment for Offshore Projects
Heavy duty marine engineering equipment: learn how to specify reliable offshore assets for safety, uptime, integration, lifecycle cost, and project success.
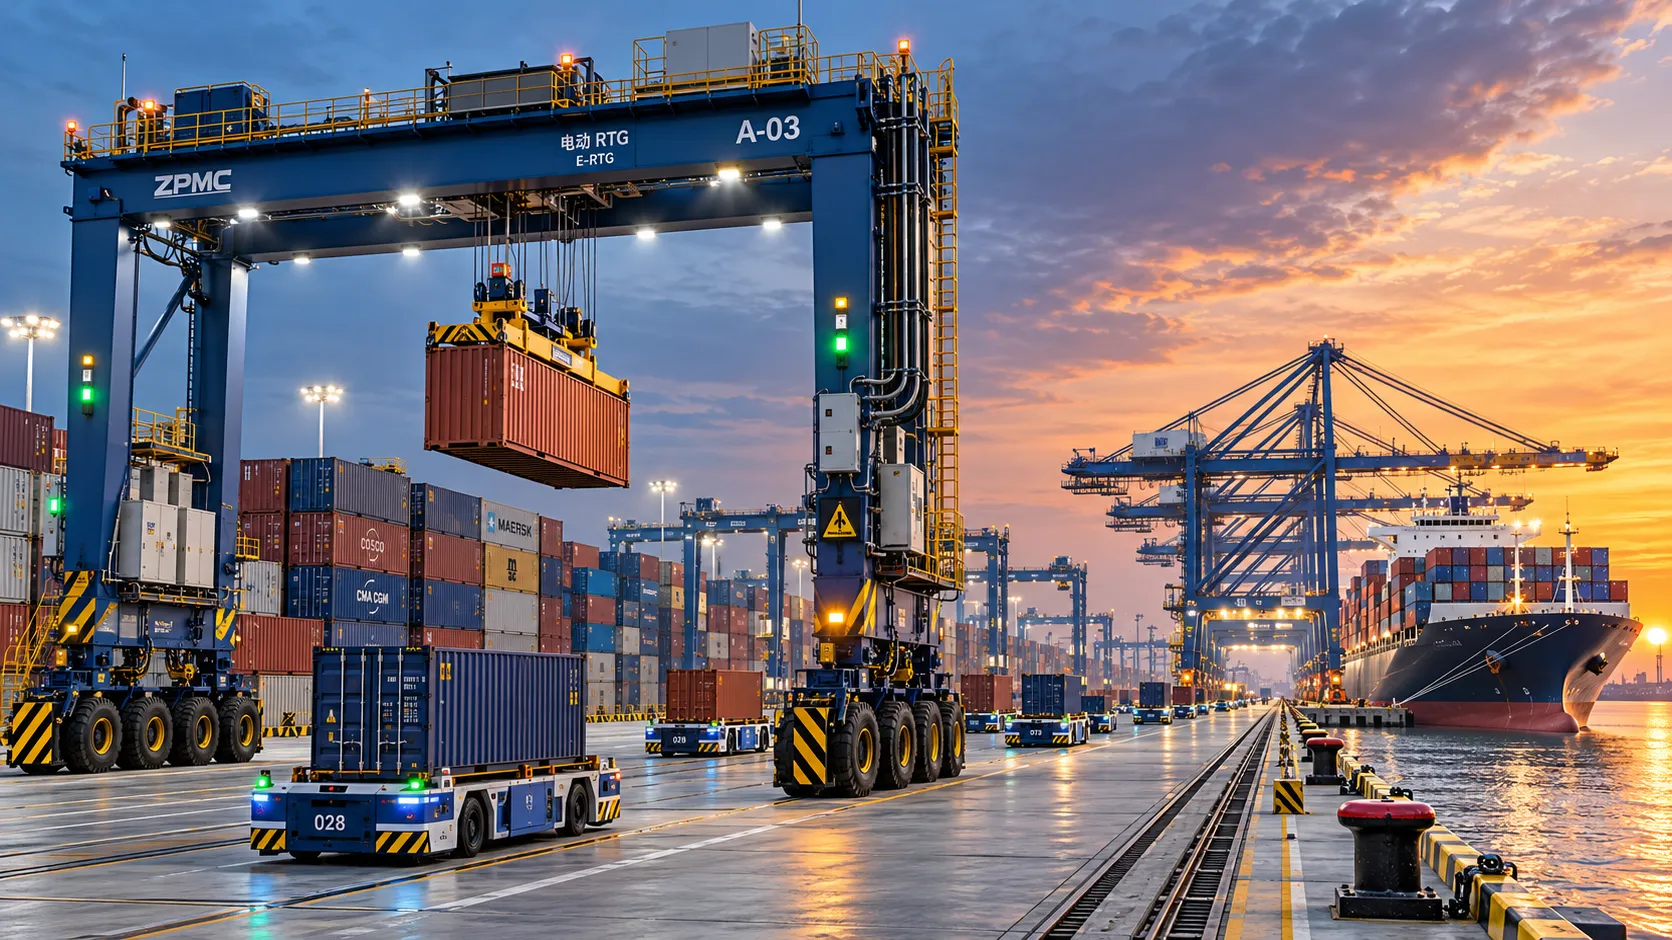
How to Evaluate a Container Handling Equipment Exporter for Port and Yard Projects
Choose the right container handling equipment exporter with a practical guide to compliance, automation, service support, delivery reliability, and lifecycle value.
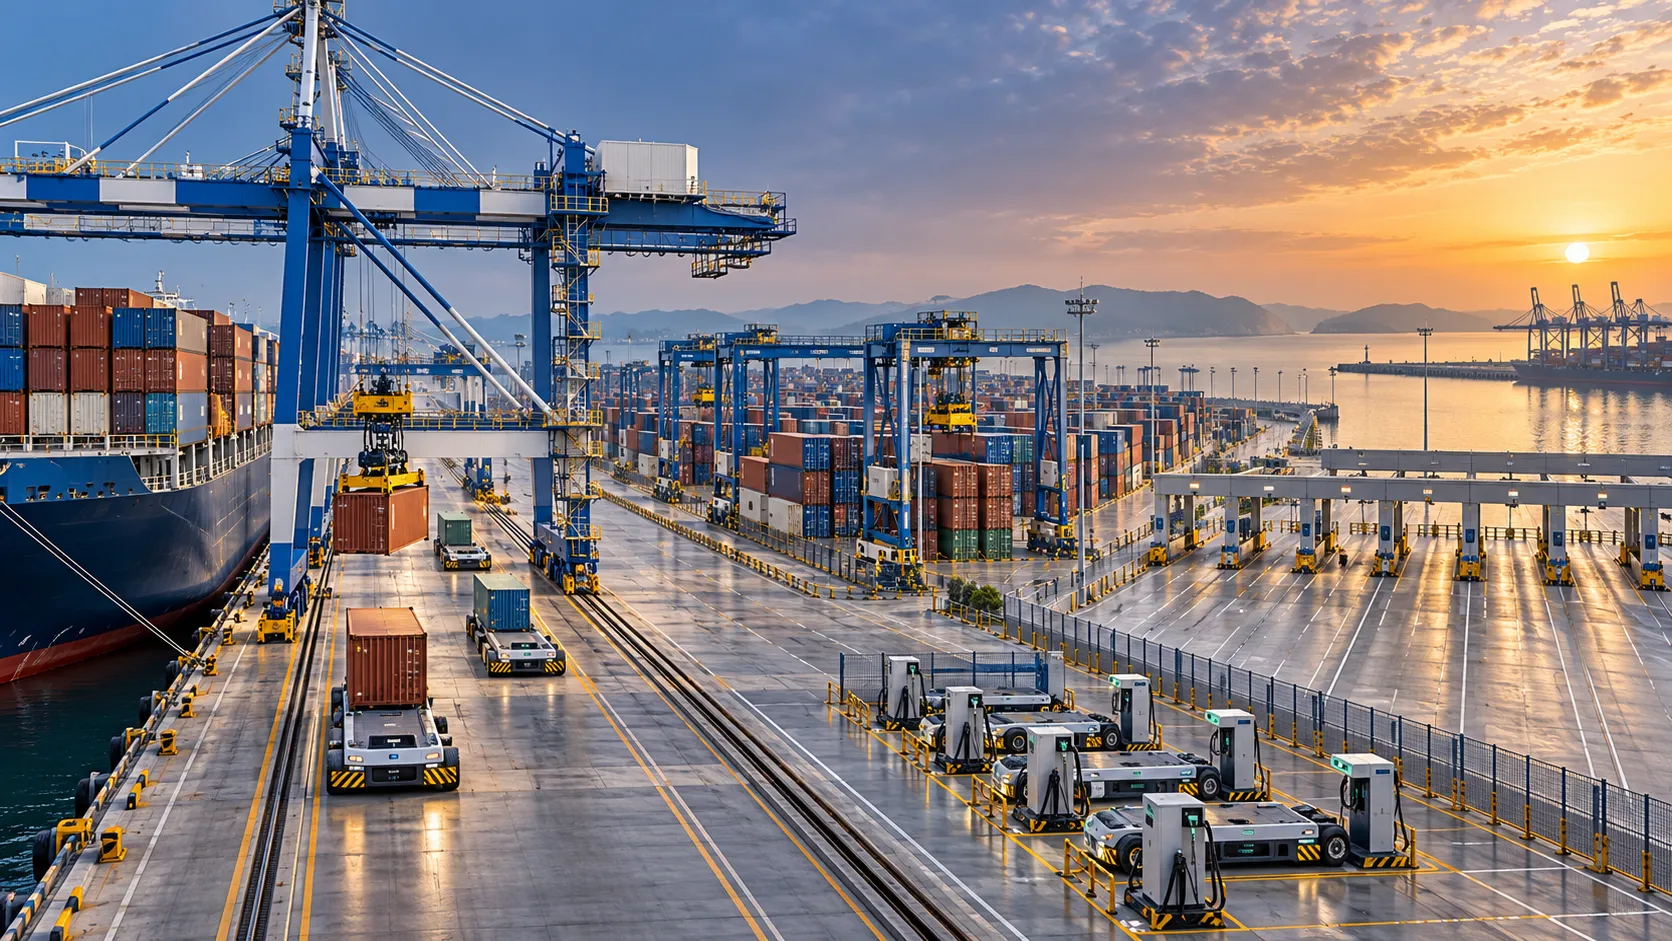
How to Select Automated Terminal Systems for High-Throughput Cargo Terminals
Automated terminal systems for cargo terminals: learn how to select scalable, resilient solutions that boost throughput, streamline integration, and control lifecycle risk.