Related News
- 00
0000-00
How Can Port Equipment Lead-Time Risk Be Managed? - 00
0000-00
Maritime Logistics Operations: How Ports Can Reduce Container Dwell Time - 00
0000-00
What Does Logistics Node Monitoring Cost Across Warehouses and Transport Hubs? - 00
0000-00
How Can IoT Smart Port Solutions Improve Container Tracking and Yard Efficiency? - 00
0000-00
How Real-Time Port Logistics Intelligence Improves Container Yard Efficiency
How maritime trade analytics can reveal hidden demand shifts
For business evaluators navigating volatile supply chains, maritime trade analytics offers a sharper way to detect hidden demand shifts before they surface in headline trade statistics.
By linking port calls, berth productivity, equipment utilization, cargo routing, and dredging activity, it reveals where trade momentum is strengthening, softening, or quietly changing direction.
For PS-Nexus, this intelligence sits at the intersection of heavy terminal gear, automation systems, and coastal infrastructure planning across the broader maritime logistics ecosystem.
Defining maritime trade analytics in an operational context
Maritime trade analytics is the structured study of shipping, port, cargo, and infrastructure data to understand trade behavior beyond customs releases or quarterly macroeconomic summaries.
It combines vessel movement records, terminal turnaround times, crane intensity, yard congestion, bulk flow patterns, and channel maintenance signals into a forward-looking decision framework.
This matters because cargo demand rarely changes in one sudden step. It usually leaves operational traces long before market consensus adjusts expectations.
A rise in feeder calls, longer berth occupancy, or faster deployment of automated stacking systems can indicate emerging trade concentration before official reports confirm it.
Core data layers commonly used
- Vessel arrivals, departures, route deviations, and port call frequency
- Container, breakbulk, dry bulk, and liquid bulk throughput signals
- Quay crane cycles, AGV dispatch trends, and yard handling efficiency
- Dredging schedules, draft constraints, and channel expansion activity
- Freight rate movements, transshipment density, and dwell-time changes
Why hidden demand shifts matter across the broader industry
Hidden demand shifts affect more than shipping lines. They influence terminal equipment planning, automation investment timing, coastal engineering priorities, and cross-border logistics resilience.
In the integrated industry landscape, one cargo pattern change can reshape several linked asset decisions at once.
For example, stronger grain exports may increase bulk handling strain, alter berth allocation logic, and trigger faster wear on conveyor systems and grab cranes.
Likewise, rising nearshoring trade may first appear as regional feeder expansion, denser short-haul loops, and higher utilization of specialized container handling assets.
Early-warning signals worth watching
How maritime trade analytics reveals shifts before headline data
Headline trade data is often delayed, revised, and too aggregated. Maritime trade analytics works earlier because it captures transactional movement inside real logistics systems.
A hidden shift becomes visible when several weak signals start aligning across cargo flow, infrastructure strain, and asset scheduling behavior.
Typical analytical chain
- Track vessel patterns by lane, frequency, and port sequence.
- Compare berth productivity with cargo mix changes.
- Measure utilization shifts in cranes, AGVs, and yard blocks.
- Assess dredging, draft, and channel expansion activity.
- Test whether all signals confirm a durable demand move.
Suppose container throughput looks flat. That may appear neutral. Yet if call sizes are growing, berth windows are tighter, and automation cycles are increasing, latent demand may be concentrating.
Another case involves bulk terminals. Stable shipment totals can mask changing cargo composition, requiring different unloading profiles, storage arrangements, and maintenance schedules.
Operational value for ports, equipment, and infrastructure intelligence
The practical value of maritime trade analytics lies in translating movement data into decisions about assets, timing, and competitive positioning.
For international intelligence platforms like PS-Nexus, the strongest insights emerge when machinery, control systems, and trade signals are interpreted together.
Key business meanings
- Identify where quay crane demand may rise before procurement cycles begin
- Spot which automated yards are gaining throughput advantage
- Measure whether dredging programs reflect temporary congestion or structural trade growth
- Understand when bulk handling capacity needs redesign, not just expansion
- Evaluate if new marine logistics corridors are becoming commercially viable
These insights support equipment forecasting, strategic intelligence building, and long-cycle infrastructure judgments in ways that simple tonnage totals cannot.
Representative demand-shift scenarios in maritime logistics
Different maritime segments produce different hidden indicators. Effective maritime trade analytics must match the signal set to the operating environment.
Practical methods for building a reliable analysis framework
A useful framework should avoid single-metric thinking. Hidden demand shifts are rarely confirmed by one dataset alone.
Recommended approach
- Separate short-term disruption from structural trend.
- Normalize for seasonality, weather, and policy noise.
- Compare operational signals across competing hubs.
- Integrate machinery utilization with cargo flow changes.
- Validate with infrastructure and engineering developments.
This method is especially important in sectors shaped by long asset lives. A misleading signal can distort investment logic for years.
Common interpretation risks
- Confusing congestion with genuine demand growth
- Ignoring route substitutions between nearby ports
- Overreading temporary policy-driven shipment spikes
- Missing how automation masks labor or time bottlenecks
Strategic next steps for intelligence-led decision support
Maritime trade analytics is most powerful when treated as an intelligence discipline, not just a reporting tool.
The strongest decisions come from combining trade observation with port equipment behavior, automation performance, and coastal engineering progress.
PS-Nexus frames this through synchronized insight across terminal gear, bulk machinery, container handling systems, control architecture, and dredging engineering.
That integrated view helps reveal whether a demand shift is temporary noise, regional rebalancing, or the start of a new maritime growth corridor.
To move from observation to action, build a monitoring model around recurring port signals, asset utilization changes, and infrastructure acceleration markers.
Used well, maritime trade analytics can expose hidden demand shifts early enough to support sharper planning, stronger positioning, and better timing across global maritime logistics.
Related News
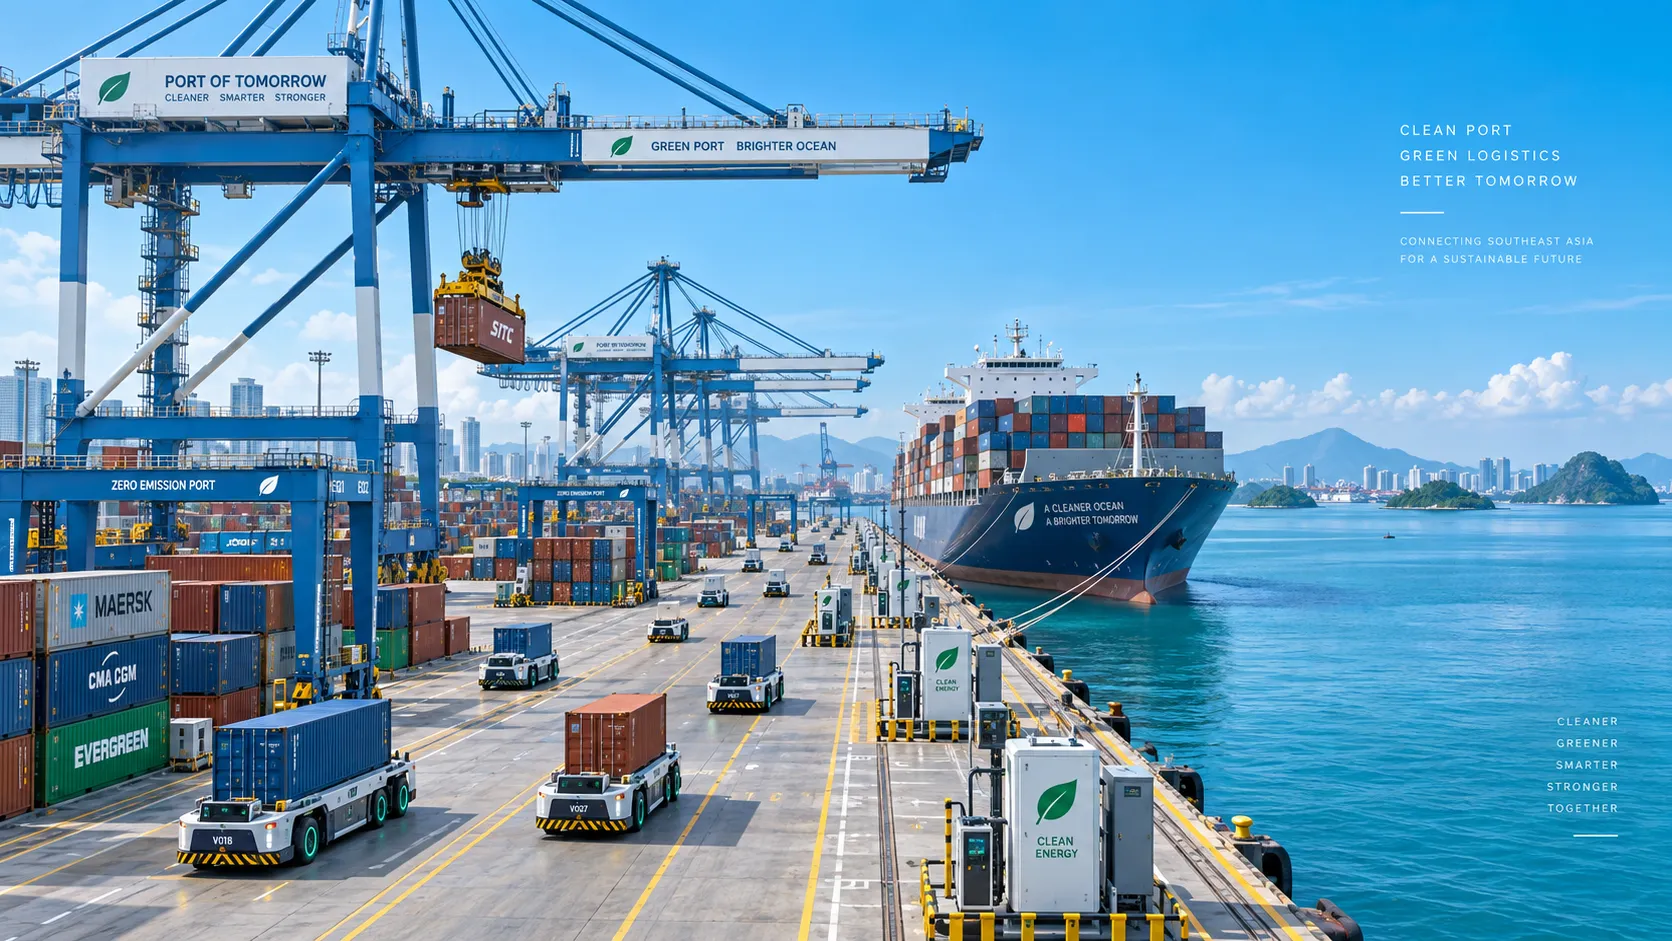
Smart Port Systems in Southeast Asia: Investment Priorities and Adoption Barriers
Smart port systems Southeast Asia: discover investment priorities, adoption barriers, and practical steps to build resilient, connected, high-performing terminals.
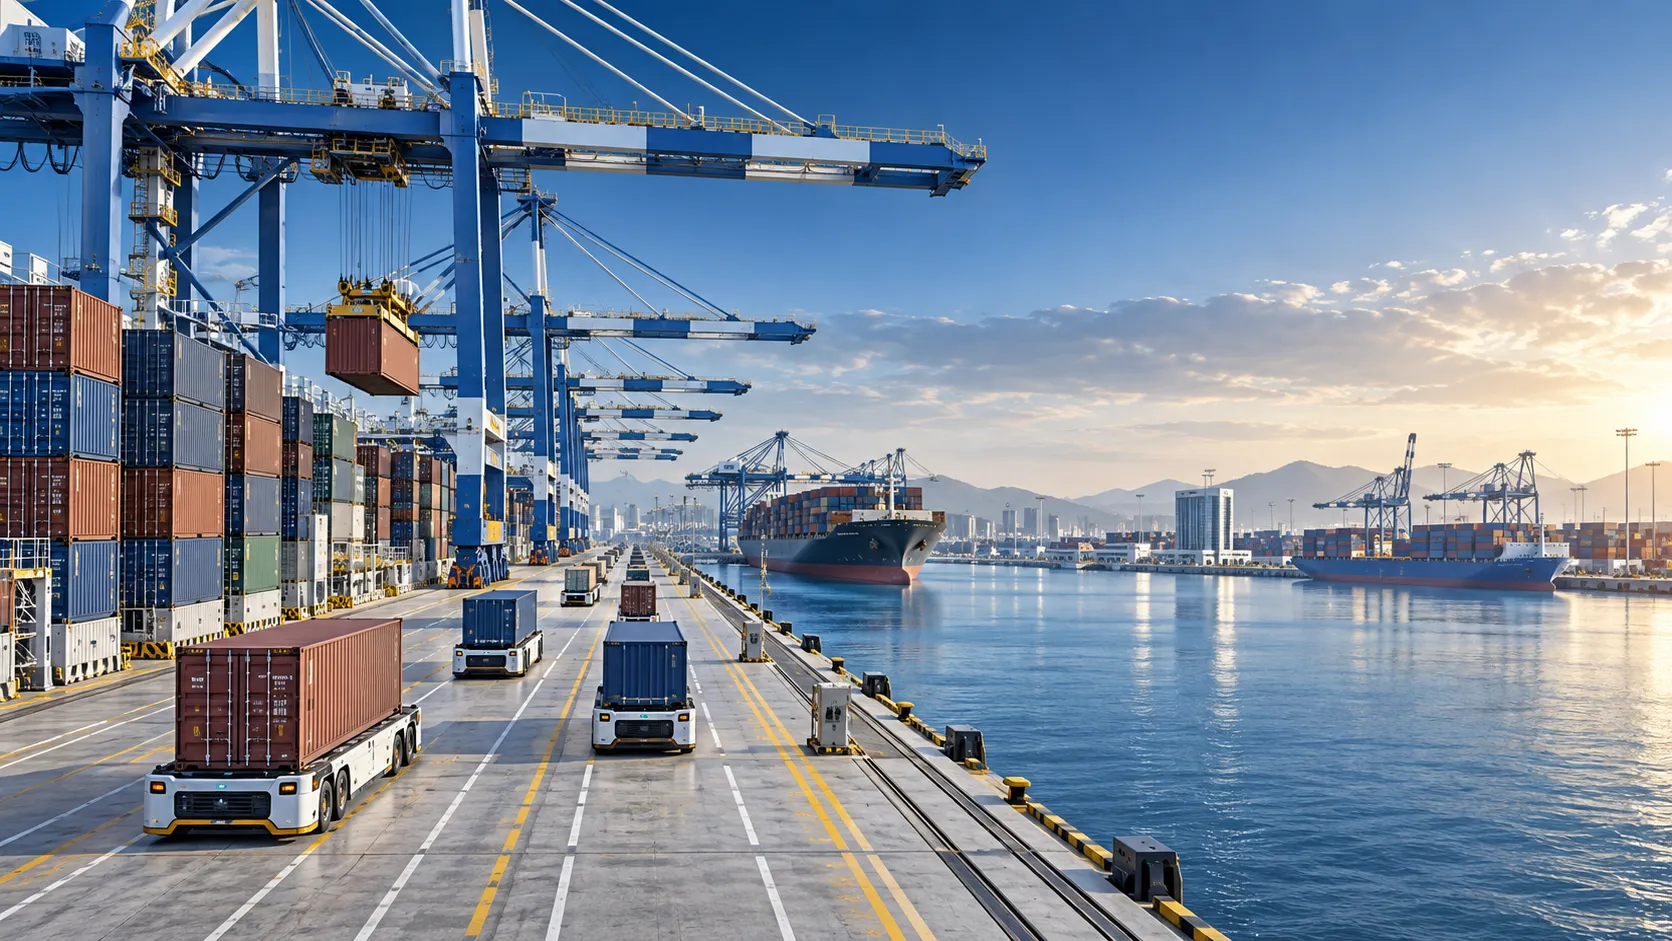
How to Evaluate Terminal Efficiency Solution Suppliers for High-Throughput Operations
Choose a terminal efficiency solutions supplier with confidence. Explore proven criteria for throughput, integration, lifecycle cost, safety, and reliable delivery.
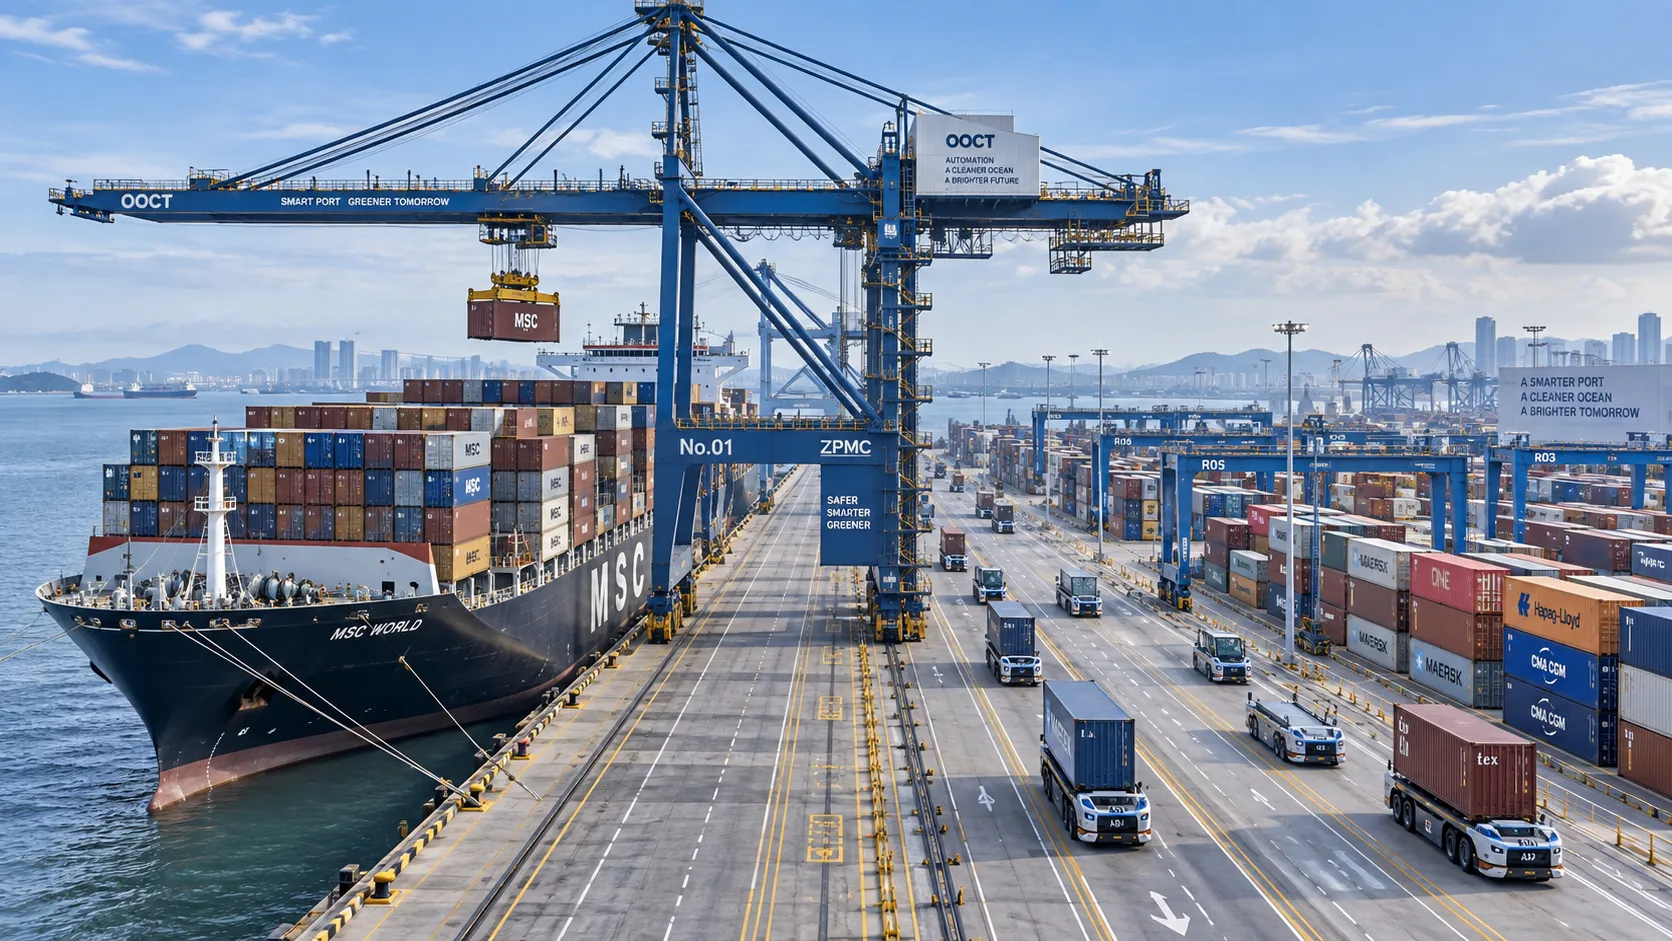
How to Specify a Quay Crane for Container Terminals by Vessel Size and Throughput?
Quay crane for container terminals: learn how to match outreach, lift height, capacity, automation, and cycle performance to vessel size and throughput goals.
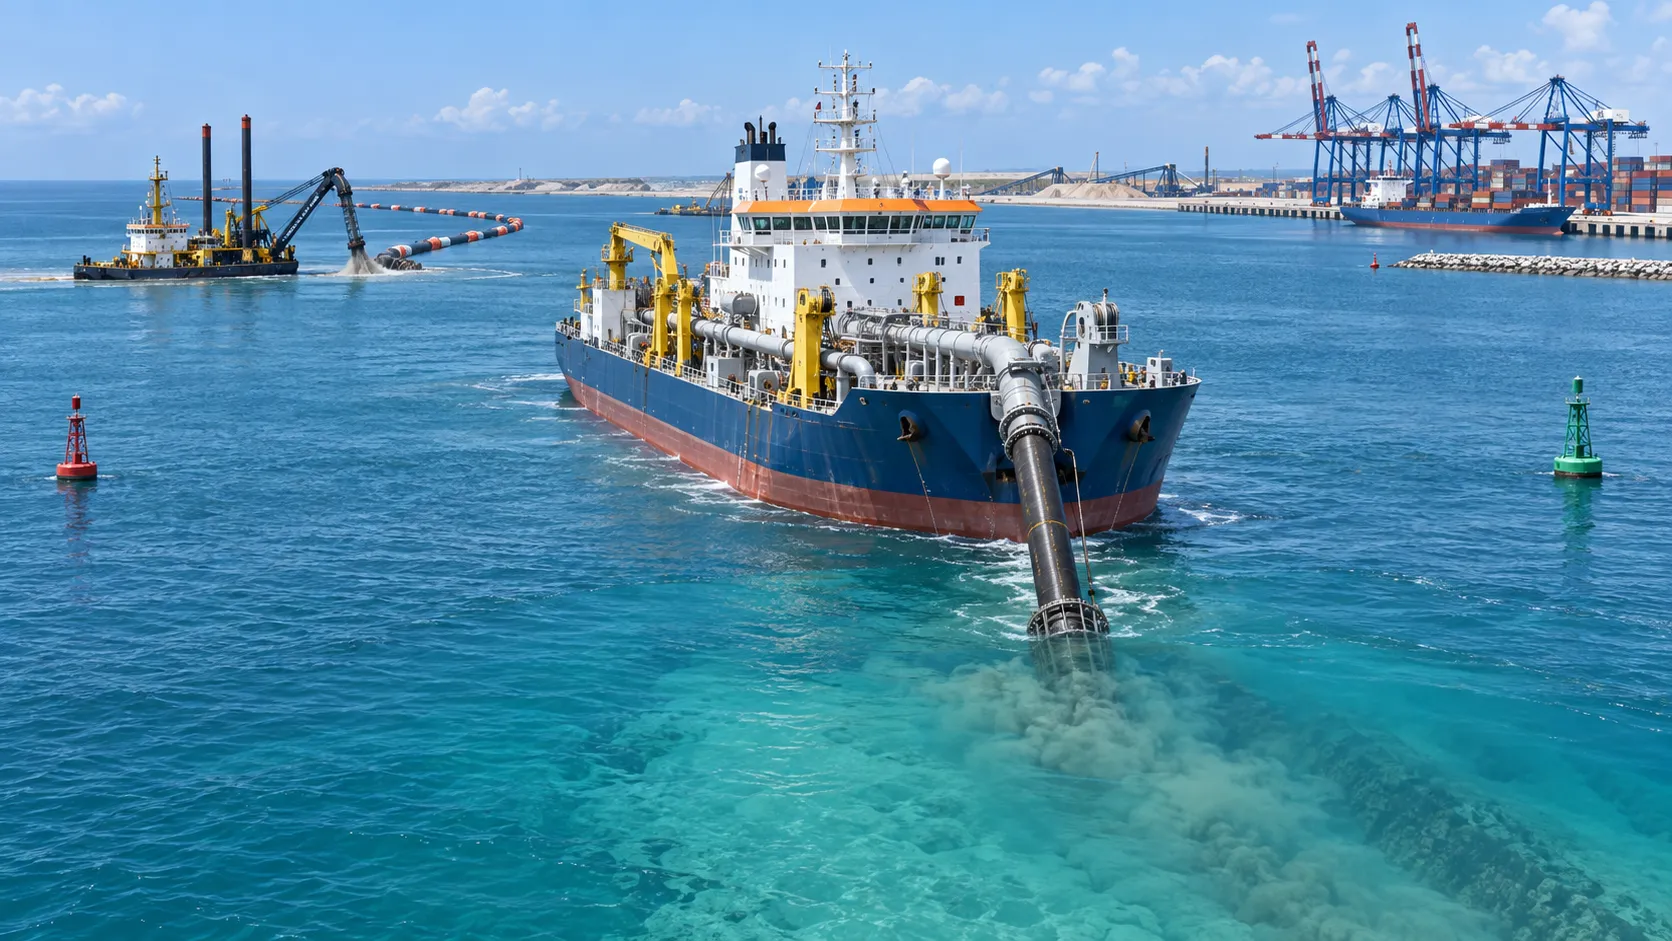
What Dredging Equipment Is Needed for Channel Deepening?
What dredging equipment is needed for channel deepening? Explore dredgers, pipelines, survey tools, and planning strategies for safer, more efficient port access.
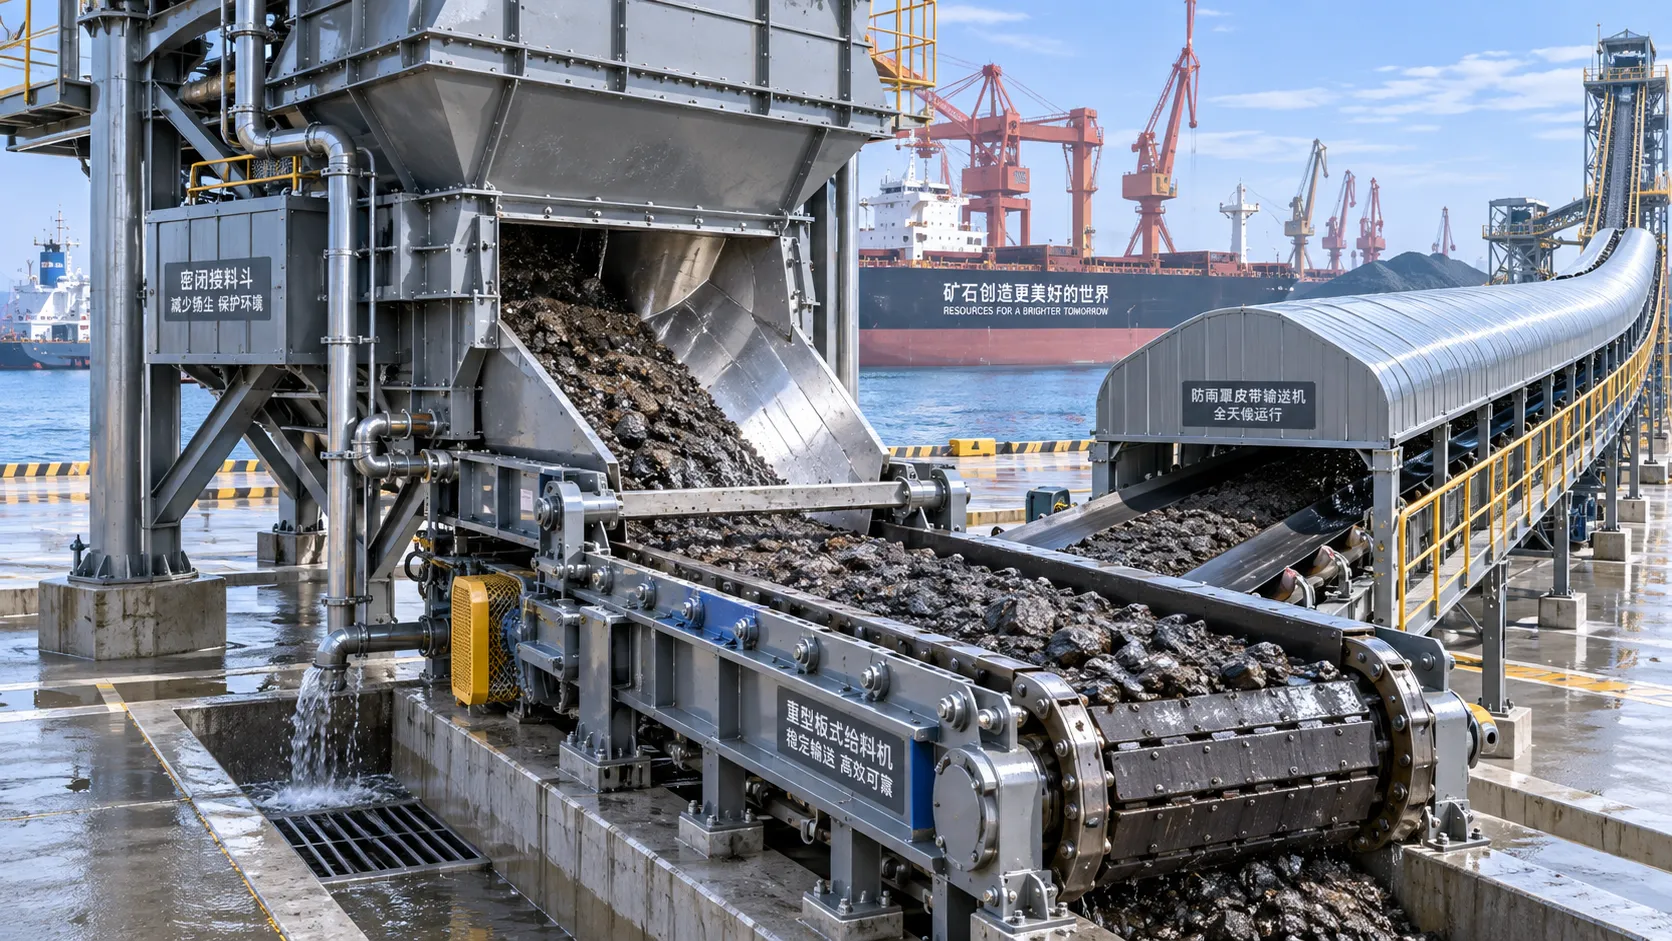
Which Bulk Handling Equipment Suits High-Moisture Cargo?
Which bulk handling equipment suits high-moisture cargo? Compare belt, apron, screw, drag, and slurry systems for reliable flow, less carryback, and higher terminal uptime.
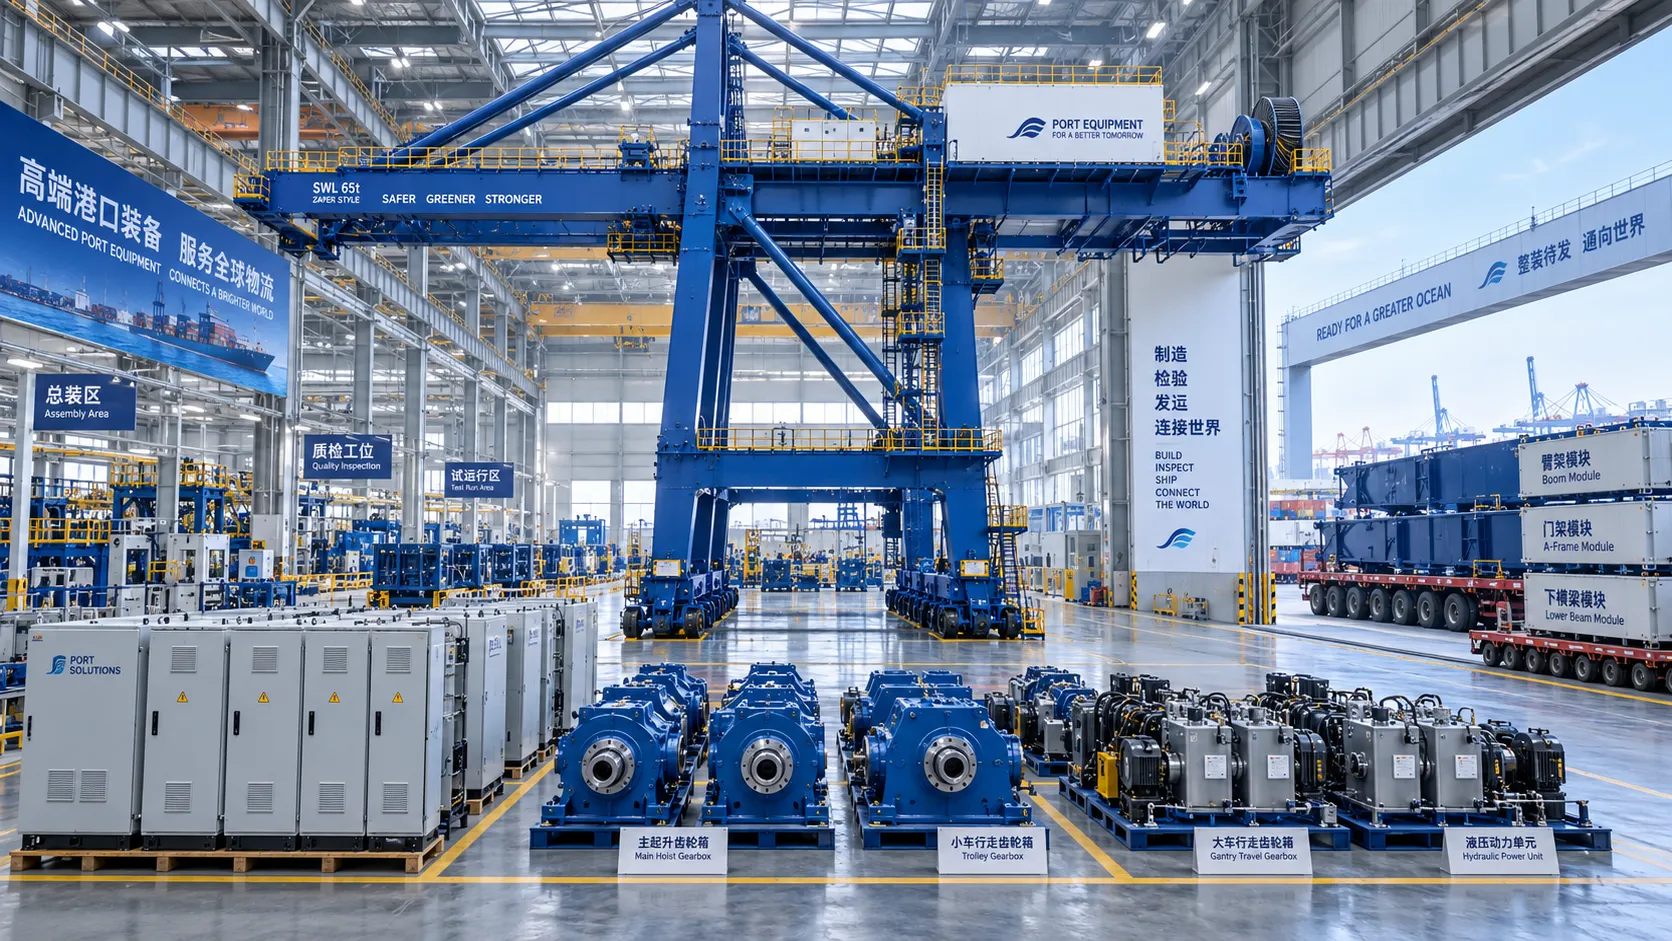
How Can Port Equipment Lead-Time Risk Be Managed?
How can port equipment lead-time risk be managed? Explore practical strategies to control critical paths, suppliers, transport, site readiness, and commissioning delays.
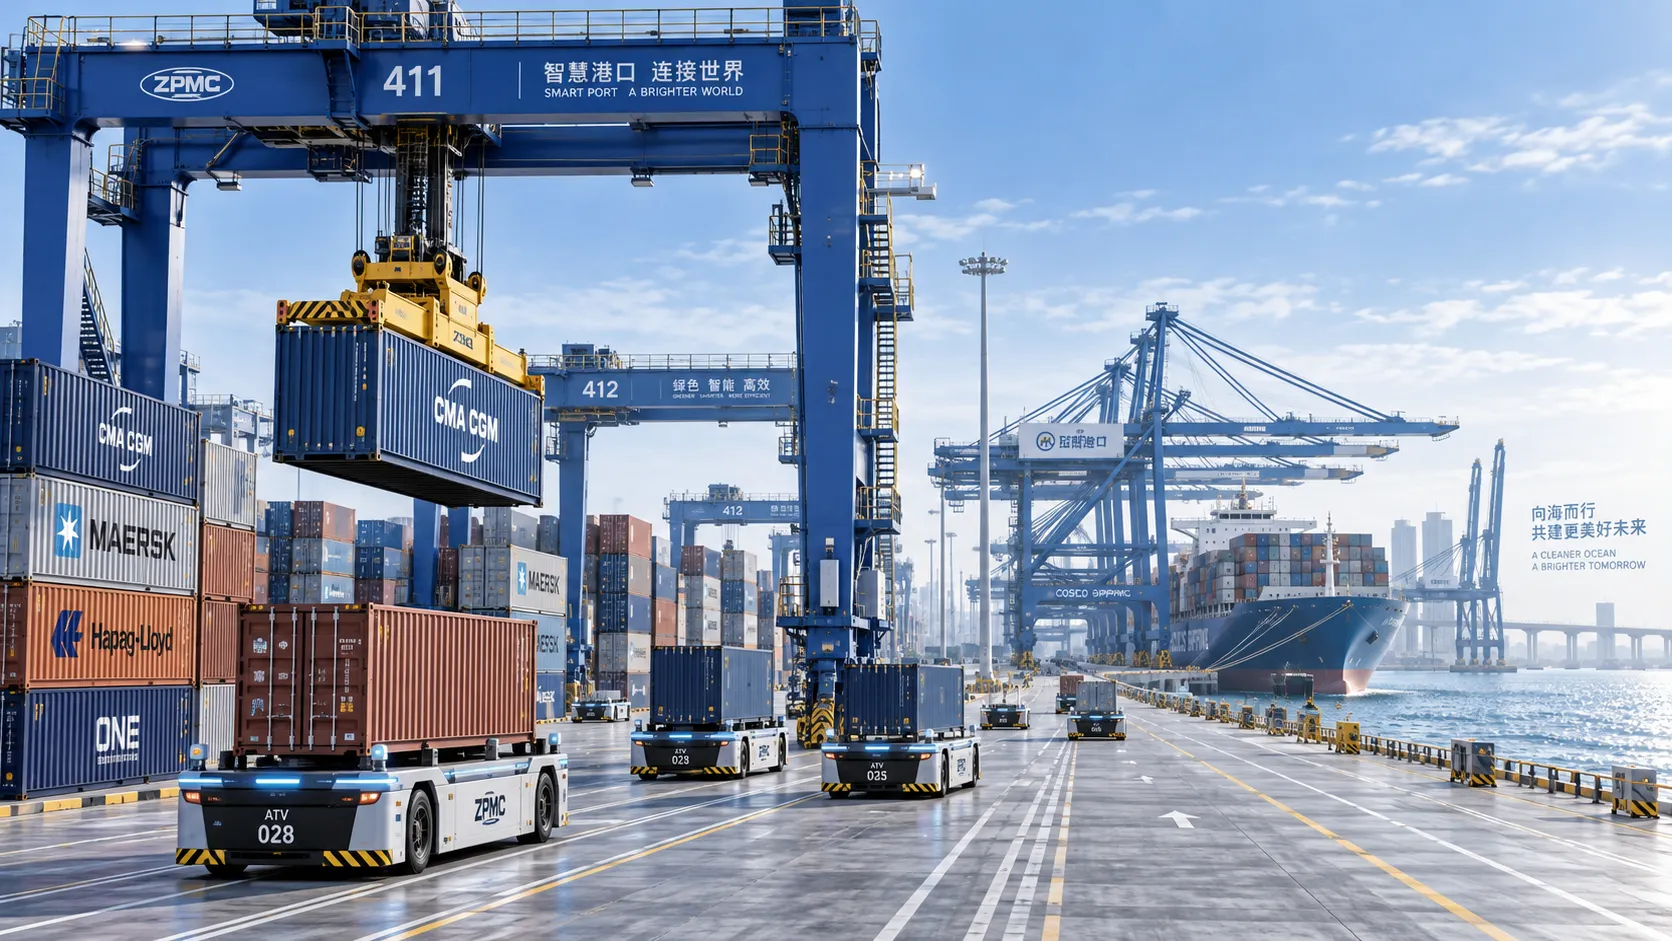
Terminal Automation Technologies That Raise Container Throughput Without Yard Disruption
Terminal automation technology that increases container throughput without disrupting yard flow. Explore smarter integration, resilient workflows, and phased deployment strategies.
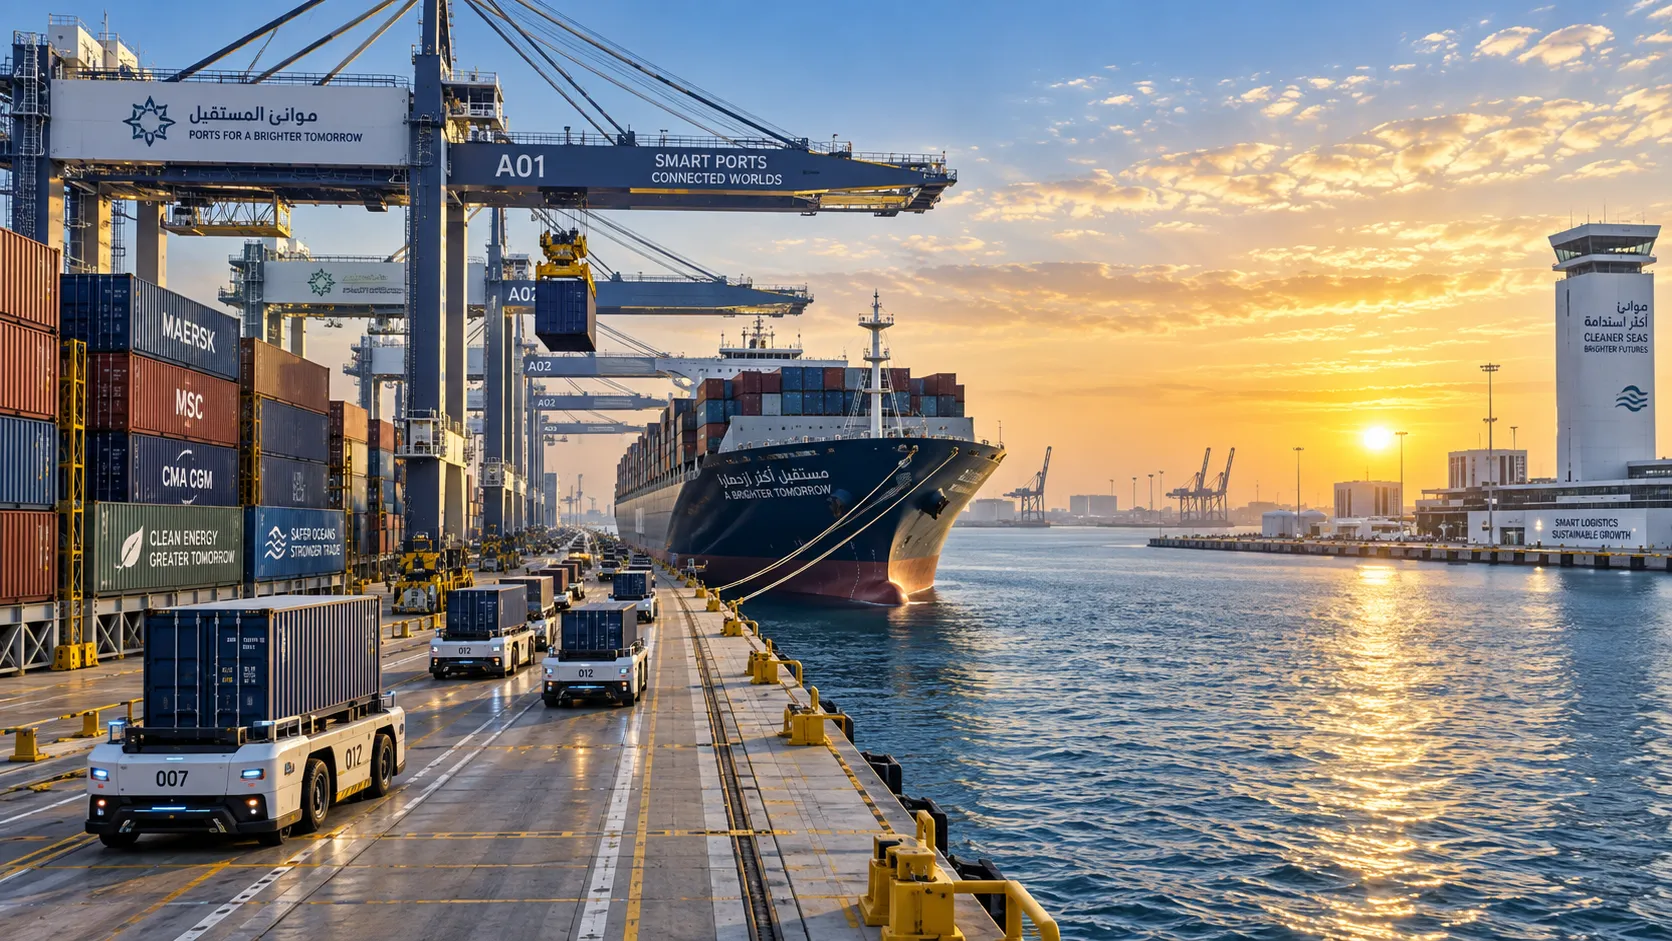
Middle East Port Automation: Key Market Drivers, Projects, and Investment Risks
Port automation systems Middle East: explore market drivers, flagship projects, integration challenges, and investment risks shaping smarter, resilient terminals.
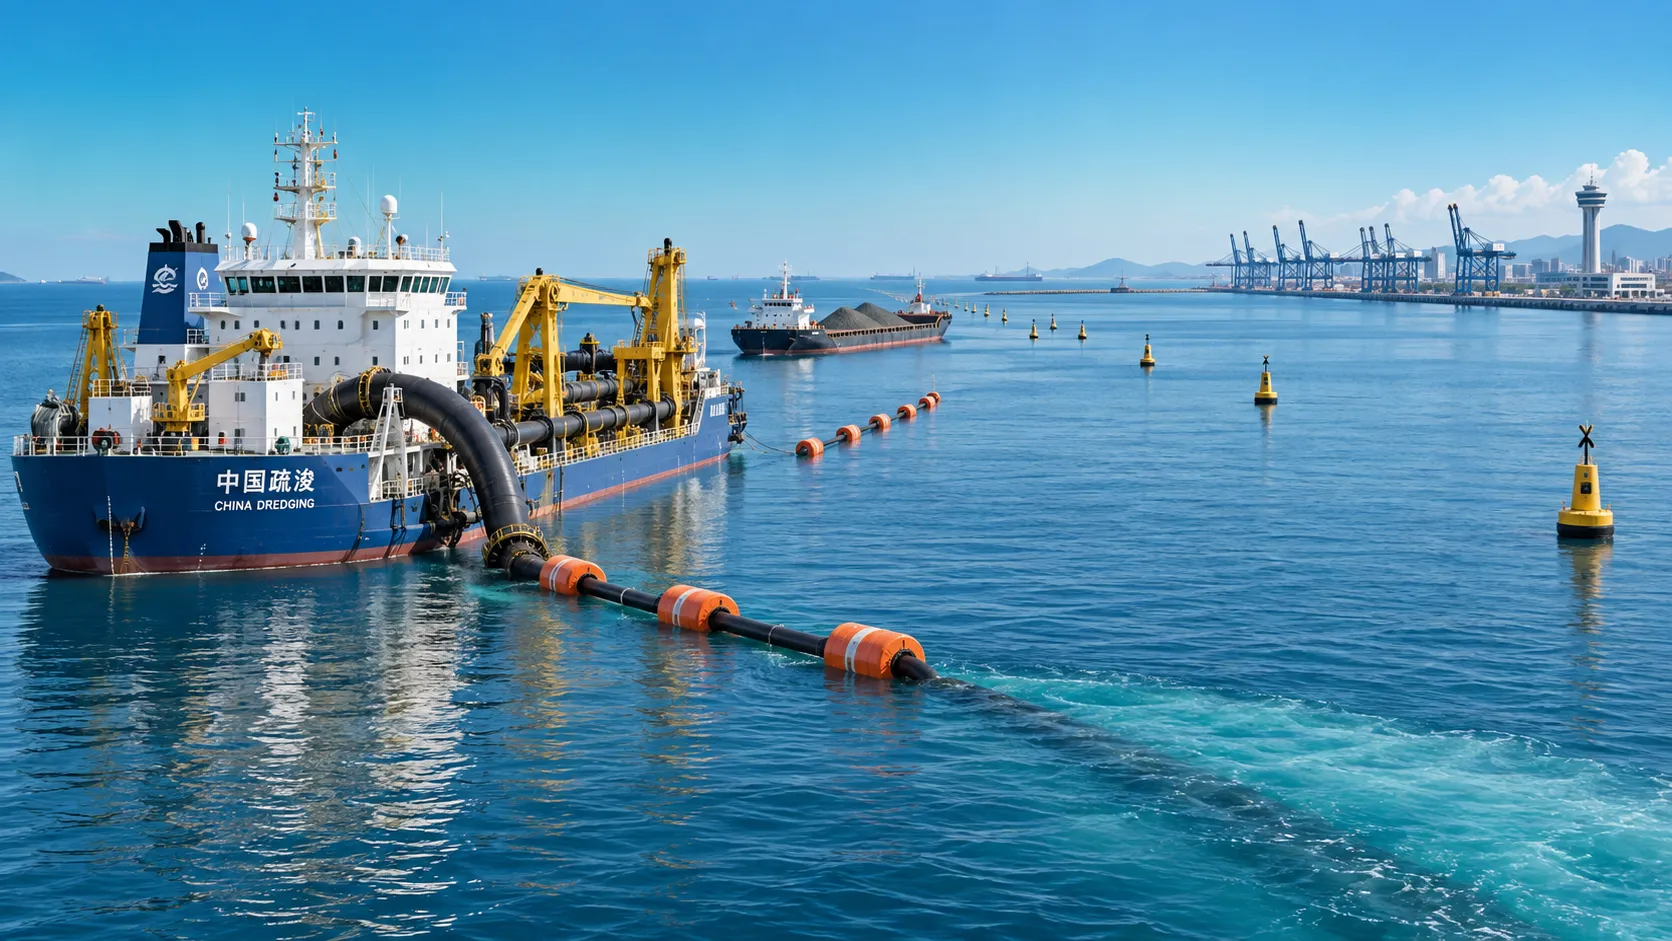
Planning Offshore Dredging Operations: Key Risks, Methods, and Project Controls
Offshore dredging operations demand smart planning. Explore key risks, proven methods, environmental controls, and project strategies for reliable delivery.