Related News
- 00
0000-00
How Can Port Equipment Lead-Time Risk Be Managed? - 00
0000-00
Maritime Logistics Operations: How Ports Can Reduce Container Dwell Time - 00
0000-00
What Does Logistics Node Monitoring Cost Across Warehouses and Transport Hubs? - 00
0000-00
How Can IoT Smart Port Solutions Improve Container Tracking and Yard Efficiency? - 00
0000-00
How Real-Time Port Logistics Intelligence Improves Container Yard Efficiency
Global Supply Chains in 2026: Where Delays Are Moving Next
In 2026, global supply chains are not just facing delays—they are redistributing them across new ports, inland corridors, and automated handling nodes. For researchers tracking maritime logistics, this shift reveals where congestion risk, equipment bottlenecks, and strategic trade vulnerabilities are likely to emerge next, making early intelligence more critical than ever.
Why are global supply chains in 2026 shifting delays instead of simply reducing them?
The biggest change in global supply chains is not a universal recovery from disruption. It is the relocation of friction. As carriers, terminal operators, shippers, and governments respond to geopolitical pressure, climate volatility, labor uncertainty, and cost inflation, they are redesigning routes rather than removing risk altogether. A delay that once appeared at a major coastal gateway may now surface at a secondary transshipment port, a rail interchange, a customs inspection point, or an automated yard with limited surge capacity.
This matters because many research models still focus on headline choke points alone. In 2026, however, delay migration is increasingly shaped by network behavior. When ocean services avoid one congestion zone, cargo often lands in ports with weaker crane availability, constrained dredged depth, fewer container handling systems, or immature port automation. The visible queue may shrink in one region while hidden dwell time grows somewhere else.
For information researchers, the key insight is that global supply chains now behave like adaptive systems. Bottlenecks move toward the least prepared node. That node may be a feeder terminal, an inland depot, a bulk transfer corridor, or a digitally advanced port whose software orchestration still depends on fragile data synchronization. This is why intelligence platforms such as PS-Nexus are increasingly valuable: equipment performance, control logic, and channel accessibility all influence where delays settle next.
Which locations are most likely to absorb the next wave of delays?
The next wave of disruption across global supply chains is likely to appear in places that are operationally important but structurally underexamined. Secondary ports are a prime example. Many have benefited from cargo diversion, nearshoring strategies, and regional manufacturing shifts, yet their berth productivity, yard density, and gate systems were not originally designed for prolonged volume spikes.
Another pressure zone is the inland corridor. When ports improve vessel turnaround but rail slots, truck appointments, chassis circulation, or customs release times remain uneven, congestion simply moves inland. Researchers should look beyond quay-side performance and assess the full cargo path. A modern terminal with fast ship-to-shore cranes can still feed a delayed supply chain if intermodal links are weak.
Automated handling nodes also deserve close attention. Automation can improve consistency, reduce labor dependency, and support higher throughput, but it does not eliminate disruption by default. If software scheduling, AGV routing, stack optimization, or sensor reliability are not tuned to volume variability, a highly automated terminal may experience a different kind of bottleneck: slower exception handling. In global supply chains, technical resilience now matters as much as physical capacity.
Researchers should also monitor dredging-sensitive trade lanes. Where sedimentation, draft limits, or delayed channel expansion affect vessel access, larger ships may be rerouted, bunched, or partially loaded. That can trigger a downstream chain of missed windows, terminal bunching, and yard imbalance. In that sense, dredging engineering is no longer a niche infrastructure issue; it is a direct variable in supply chain reliability.
What signals should researchers track to predict where global supply chains will slow next?
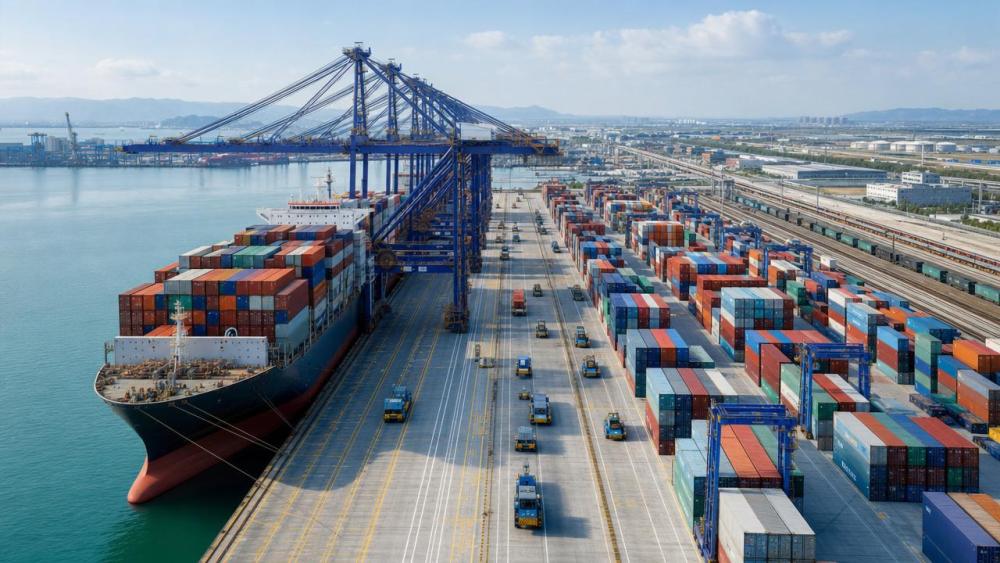
Watching vessel queues alone is no longer enough. To understand global supply chains in 2026, researchers need a layered signal set combining marine infrastructure, equipment health, terminal logic, and inland flow performance. The goal is to identify not just current congestion, but where latent fragility is building.
Practical indicators include berth productivity trends, crane uptime, yard occupancy ratios, truck turn times, rail dwell, gate appointment reliability, and draft constraints. It is also useful to study service blank sailings, transshipment reshuffling, and changes in feeder frequency, because these often reveal attempts to route around emerging trouble.
On the technical side, researchers should pay attention to the maturity of port automation and control systems. A terminal may advertise automation, but the real question is whether its operating system can absorb irregular cargo peaks, weather interruptions, and equipment exceptions without creating cascading delays. Low-latency communication for remote crane operation, path-planning quality for AGVs, and digital monitoring for pumps and dredging systems all contribute to whether a node remains fluid under stress.
Who is most affected when delays move across global supply chains?
Although every trade participant feels disruption, the impact is not evenly distributed. Researchers, procurement teams, carriers, terminal equipment suppliers, and infrastructure investors all face different exposure. For cargo owners, the danger lies in inventory uncertainty and rising landed cost. For terminal operators, it lies in asset strain, labor planning complexity, and reputational risk. For equipment makers and distributors, delay migration can reshape demand toward automation retrofits, specialized container handling systems, and bulk transfer upgrades.
This is especially relevant in sectors linked to heavy terminal gear and marine engineering. If cargo diversion increases throughput at less mature ports, those locations may urgently need stronger ship-to-shore handling capability, better yard mobility, and smarter control architecture. In parallel, channels that cannot support larger vessels may require more aggressive dredging programs. As a result, changes in global supply chains often become early commercial signals for equipment procurement and infrastructure modernization.
For information researchers, the lesson is clear: do not study delays only as transport failures. They are also market signals. They reveal where mechanical capacity, digital coordination, and marine civil engineering are becoming strategic priorities.
How can researchers distinguish a temporary disruption from a structural shift in global supply chains?
A temporary disruption usually has a short-lived trigger and a clear reversion path. Examples include weather interruptions, isolated labor actions, or one-off customs slowdowns. A structural shift, by contrast, changes routing logic, asset deployment, or investment priorities for an extended period. In global supply chains, structural change is often visible when carriers redesign service networks, shippers alter sourcing geography, or ports accelerate automation and dredging to capture redirected cargo permanently.
One useful test is duration plus adaptation. If delays persist long enough that stakeholders begin adding cranes, deepening channels, revising terminal operating procedures, or upgrading software scheduling, the issue is no longer temporary. Another test is replication. If similar stress patterns appear across multiple regions, that suggests a wider structural rebalancing rather than a local incident.
Researchers should also compare utilization trends with investment behavior. When a port authority, private terminal, or logistics corridor starts funding additional handling machinery, remote-control systems, or dredging assets, it often signals confidence that cargo patterns have changed for more than one season. These are the moments when strategic intelligence becomes more valuable than backward-looking traffic data.
What are the most common mistakes people make when evaluating global supply chains in 2026?
One common mistake is assuming that lower vessel waiting time means the supply chain is healthier. In reality, cargo may simply be delayed later in the journey. Another mistake is focusing only on major gateways while ignoring feeder ports, inland terminals, and river or coastal access constraints. Delay migration thrives in overlooked nodes.
A third error is treating automation as a guaranteed solution. Port automation can strengthen global supply chains, but only when software logic, maintenance discipline, training, and exception workflows are mature. Poorly integrated systems can accelerate normal operations while struggling during irregular peaks.
There is also a tendency to separate physical infrastructure from digital performance. That division no longer works. A port with strong cranes but weak scheduling logic, or a deep channel with poor yard orchestration, can still become a bottleneck. In 2026, the performance of global supply chains depends on synchronized mechanics, data, and marine access.
What should businesses and researchers verify before making decisions based on global supply chains data?
Before acting on supply chain intelligence, verify whether the data reflects the entire logistics path or only one visible segment. A port dashboard may look healthy while inland evacuation is deteriorating. Check whether throughput gains are being supported by adequate crane availability, yard equipment, bulk handling continuity, and dredging reliability. If not, apparent resilience may be temporary.
It is also important to verify whether performance improvements are operational or merely comparative. A port may seem efficient only because cargo volumes elsewhere collapsed. Researchers should ask whether the node can handle sustained growth, larger vessels, tighter windows, and more complex transshipment patterns without operational drift.
For companies evaluating partners, procurement direction, or market entry, a simple decision checklist helps:
What does this mean for next-step planning in global supply chains?
The central takeaway is that global supply chains in 2026 should be analyzed as moving systems of redistributed pressure. Delays are no longer concentrated only in famous chokepoints. They are appearing where cargo rerouting meets insufficient terminal gear, immature automation, constrained inland corridors, or delayed marine engineering upgrades. That creates both risk and opportunity.
For researchers, the best approach is to combine network data with infrastructure intelligence. For commercial teams, it means looking beyond freight headlines and asking where handling capacity, control systems, and dredging demand are likely to rise next. For decision-makers in maritime logistics, the question is no longer whether global supply chains will face delay, but where the next operational burden will land.
If you need to confirm a more specific direction, it is useful to first discuss which corridors are absorbing diverted cargo, which terminals are showing equipment strain, whether automated nodes can manage exception loads, how dredging conditions affect vessel access, and what investment signals suggest a temporary disruption is becoming a long-term shift.
Related News
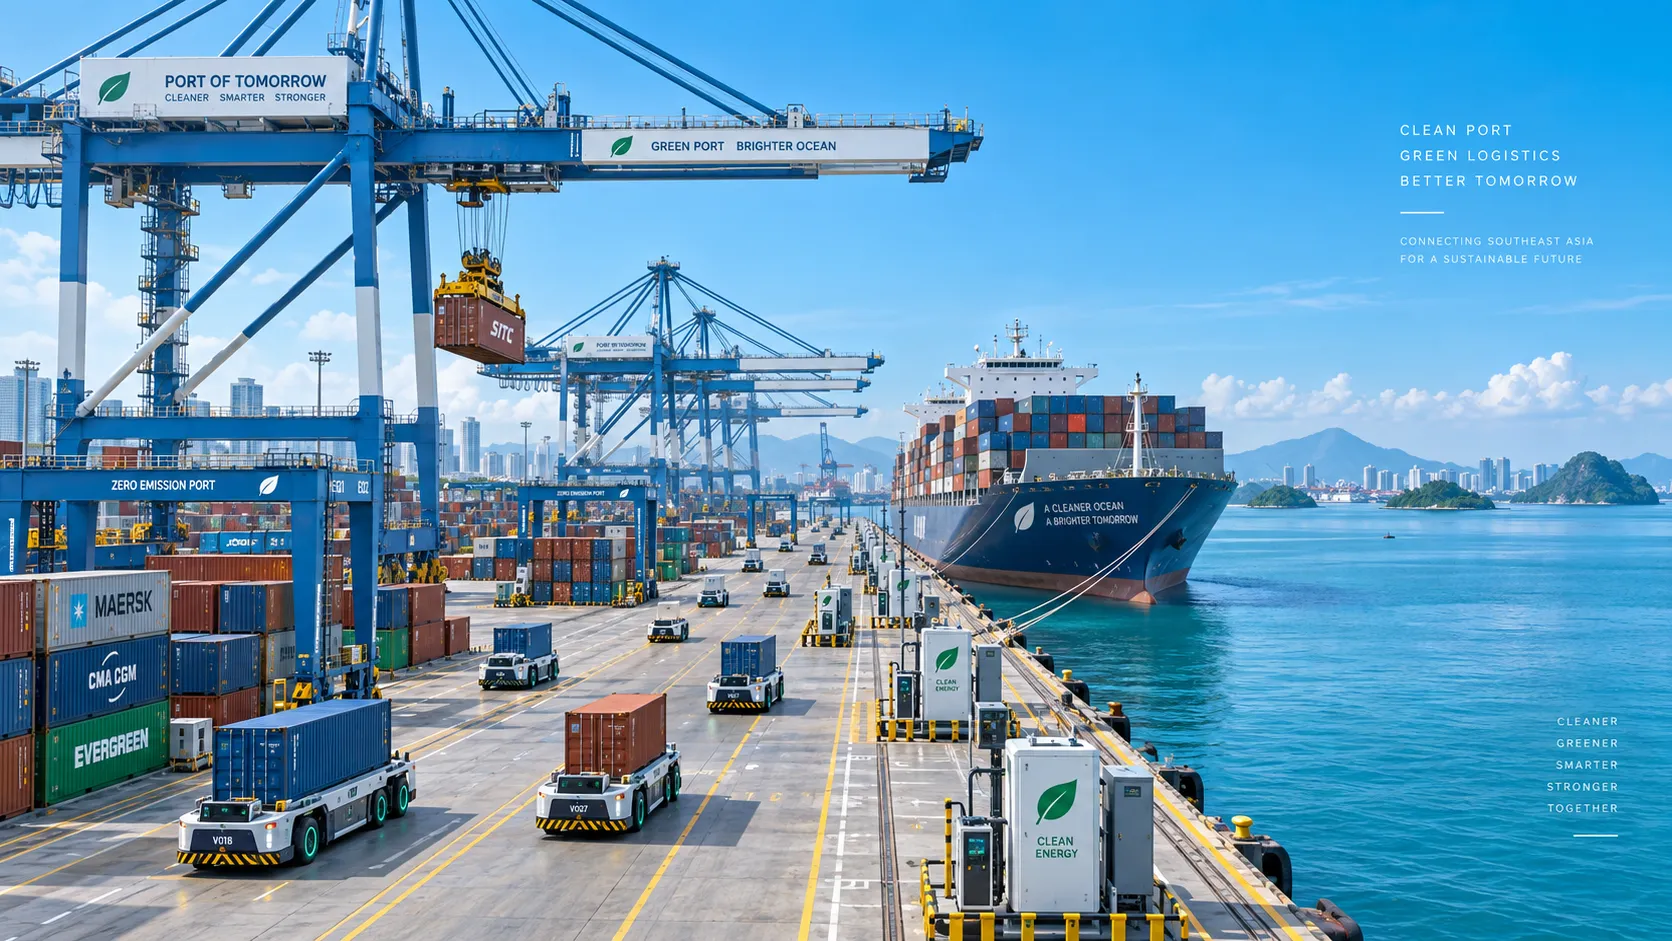
Smart Port Systems in Southeast Asia: Investment Priorities and Adoption Barriers
Smart port systems Southeast Asia: discover investment priorities, adoption barriers, and practical steps to build resilient, connected, high-performing terminals.
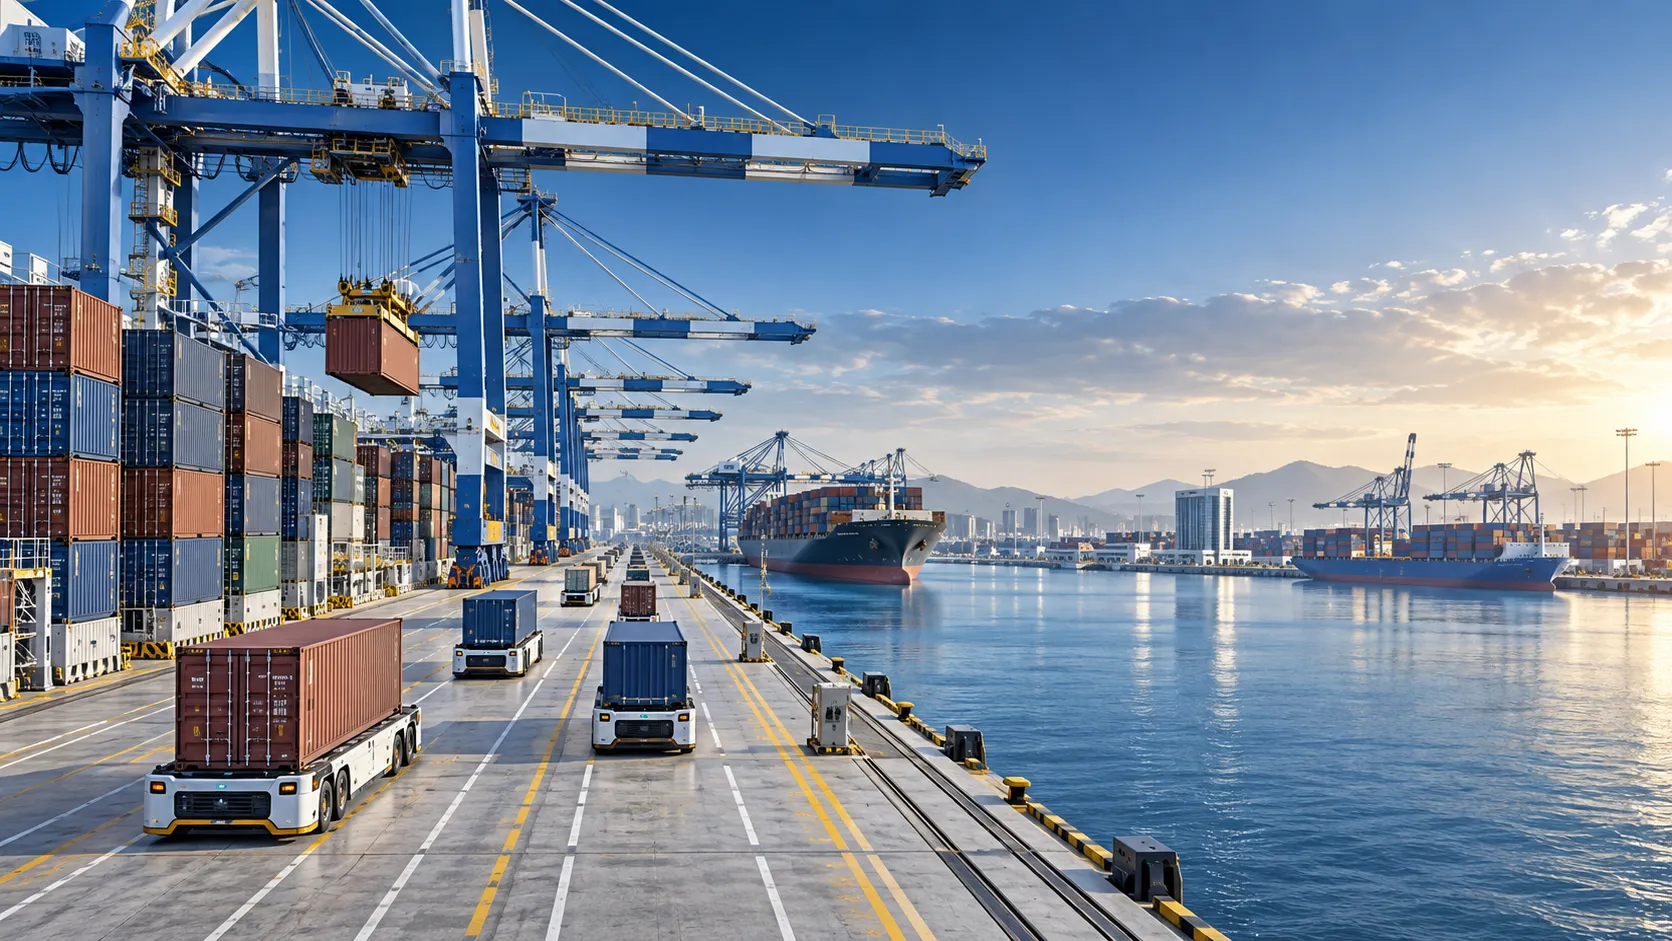
How to Evaluate Terminal Efficiency Solution Suppliers for High-Throughput Operations
Choose a terminal efficiency solutions supplier with confidence. Explore proven criteria for throughput, integration, lifecycle cost, safety, and reliable delivery.
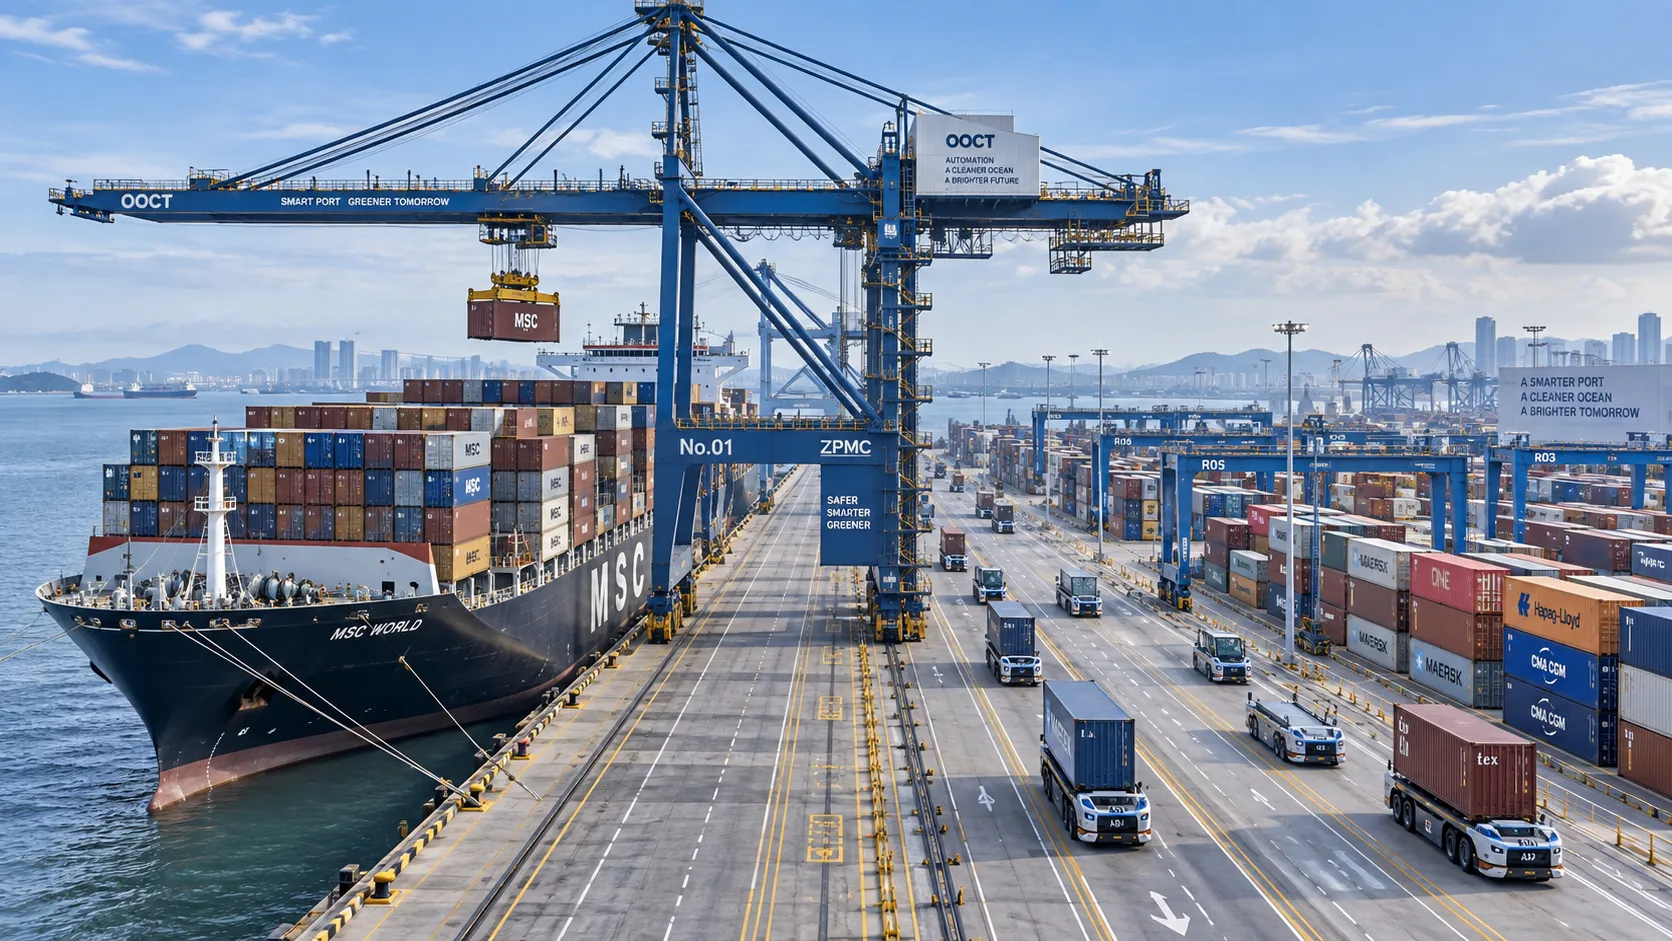
How to Specify a Quay Crane for Container Terminals by Vessel Size and Throughput?
Quay crane for container terminals: learn how to match outreach, lift height, capacity, automation, and cycle performance to vessel size and throughput goals.
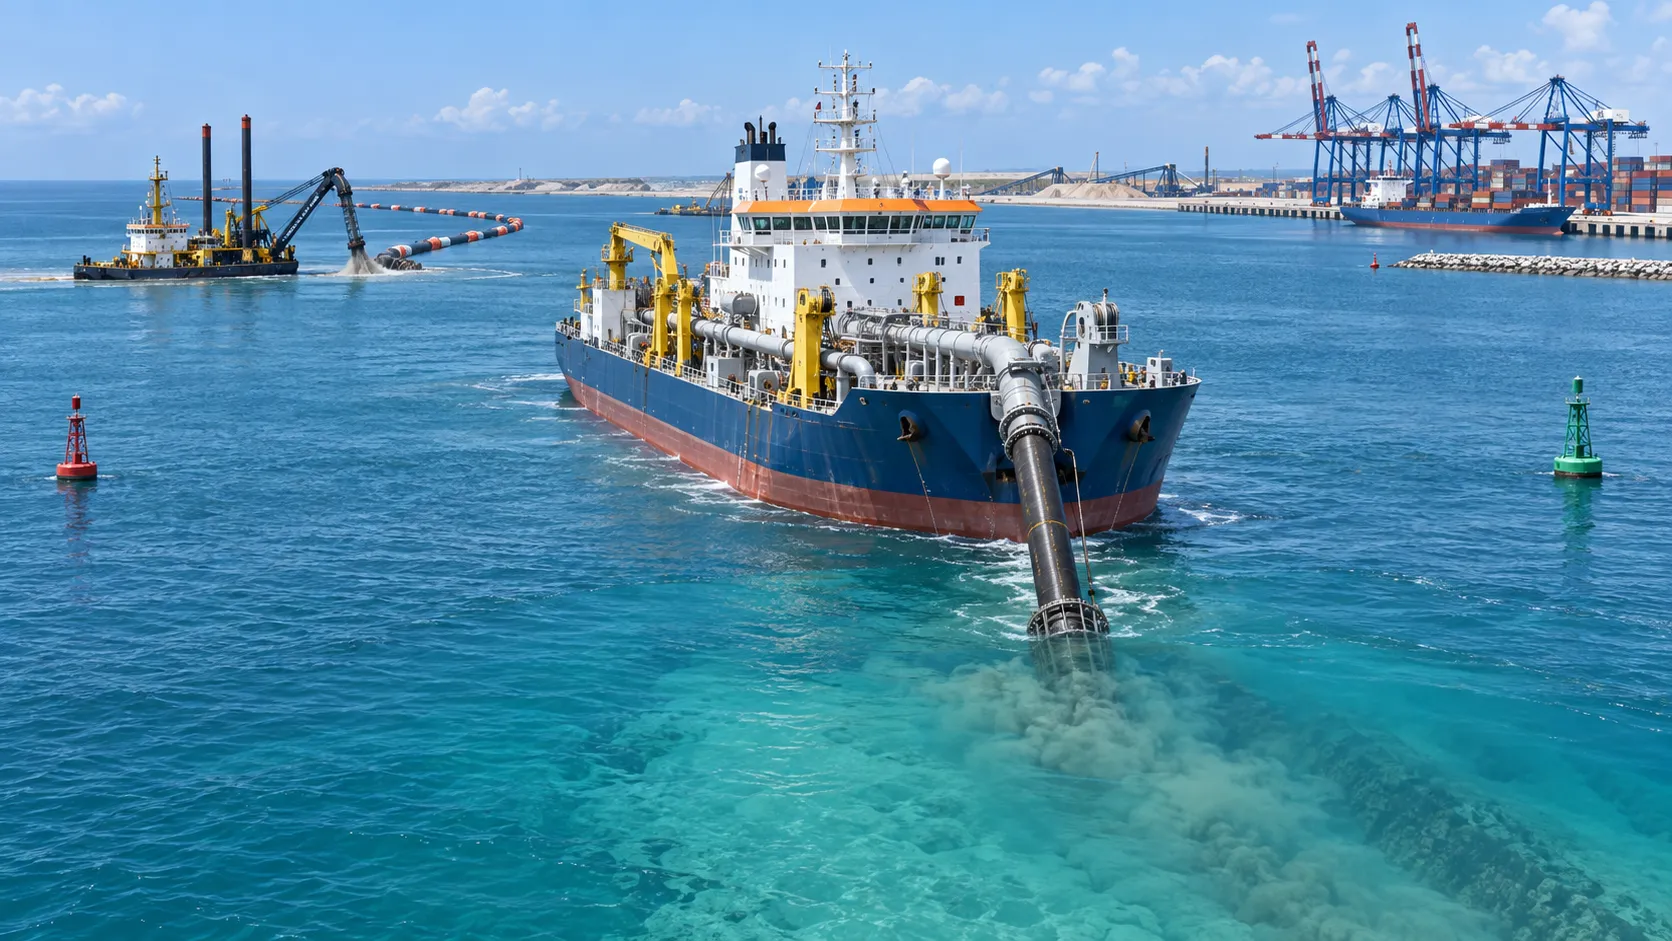
What Dredging Equipment Is Needed for Channel Deepening?
What dredging equipment is needed for channel deepening? Explore dredgers, pipelines, survey tools, and planning strategies for safer, more efficient port access.
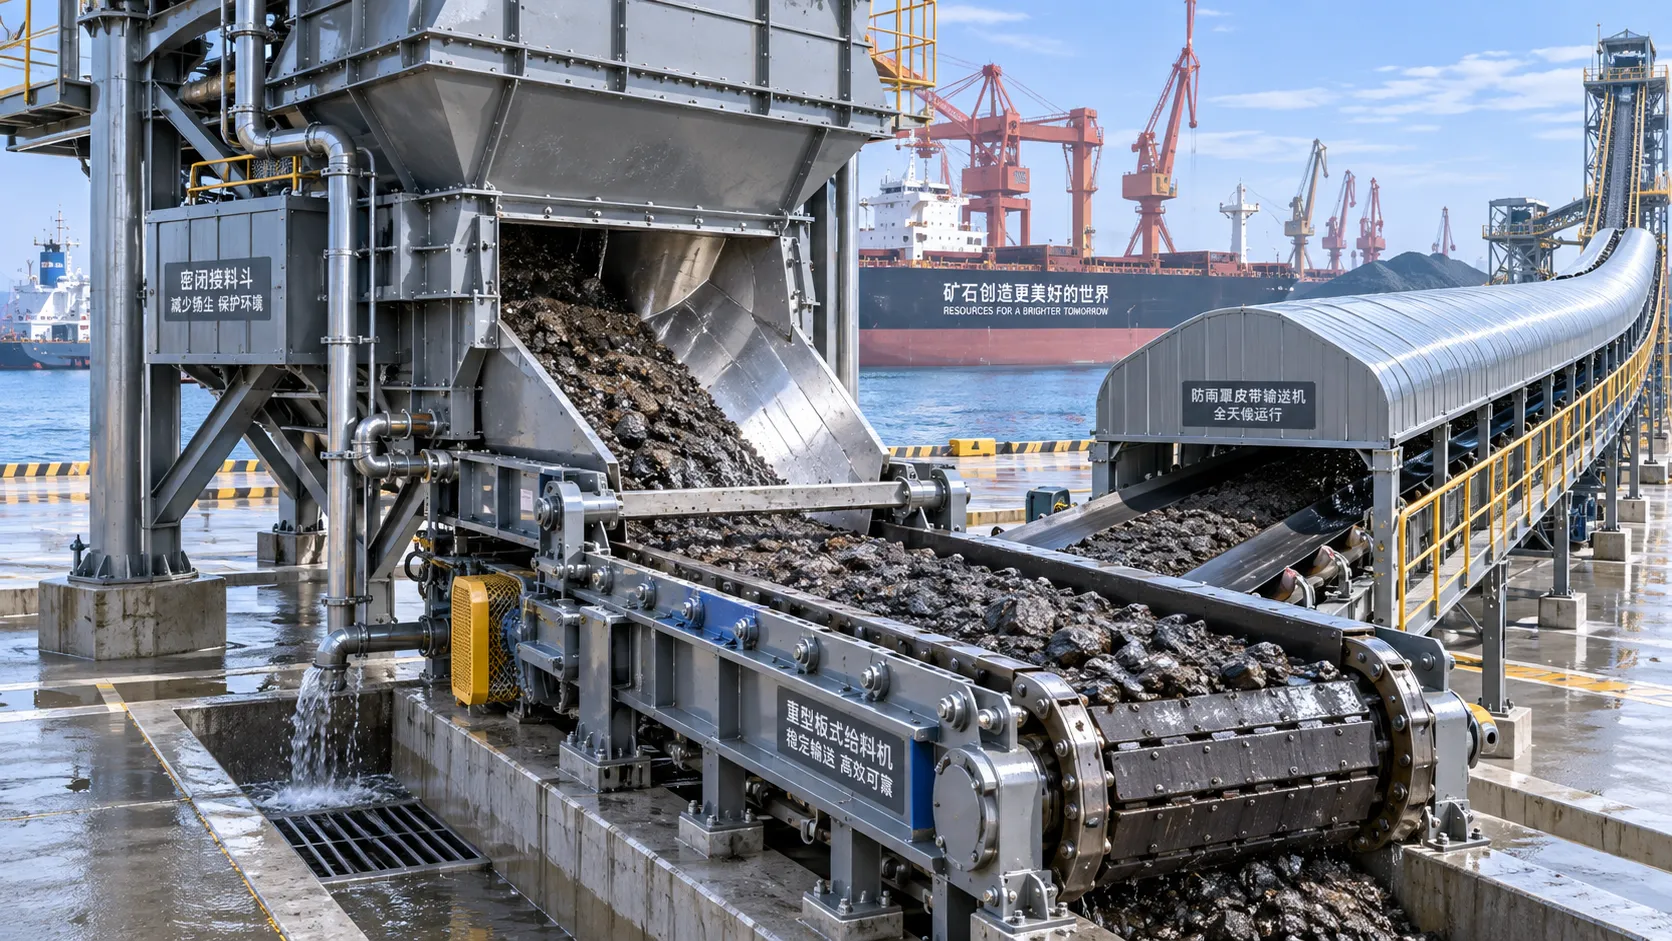
Which Bulk Handling Equipment Suits High-Moisture Cargo?
Which bulk handling equipment suits high-moisture cargo? Compare belt, apron, screw, drag, and slurry systems for reliable flow, less carryback, and higher terminal uptime.
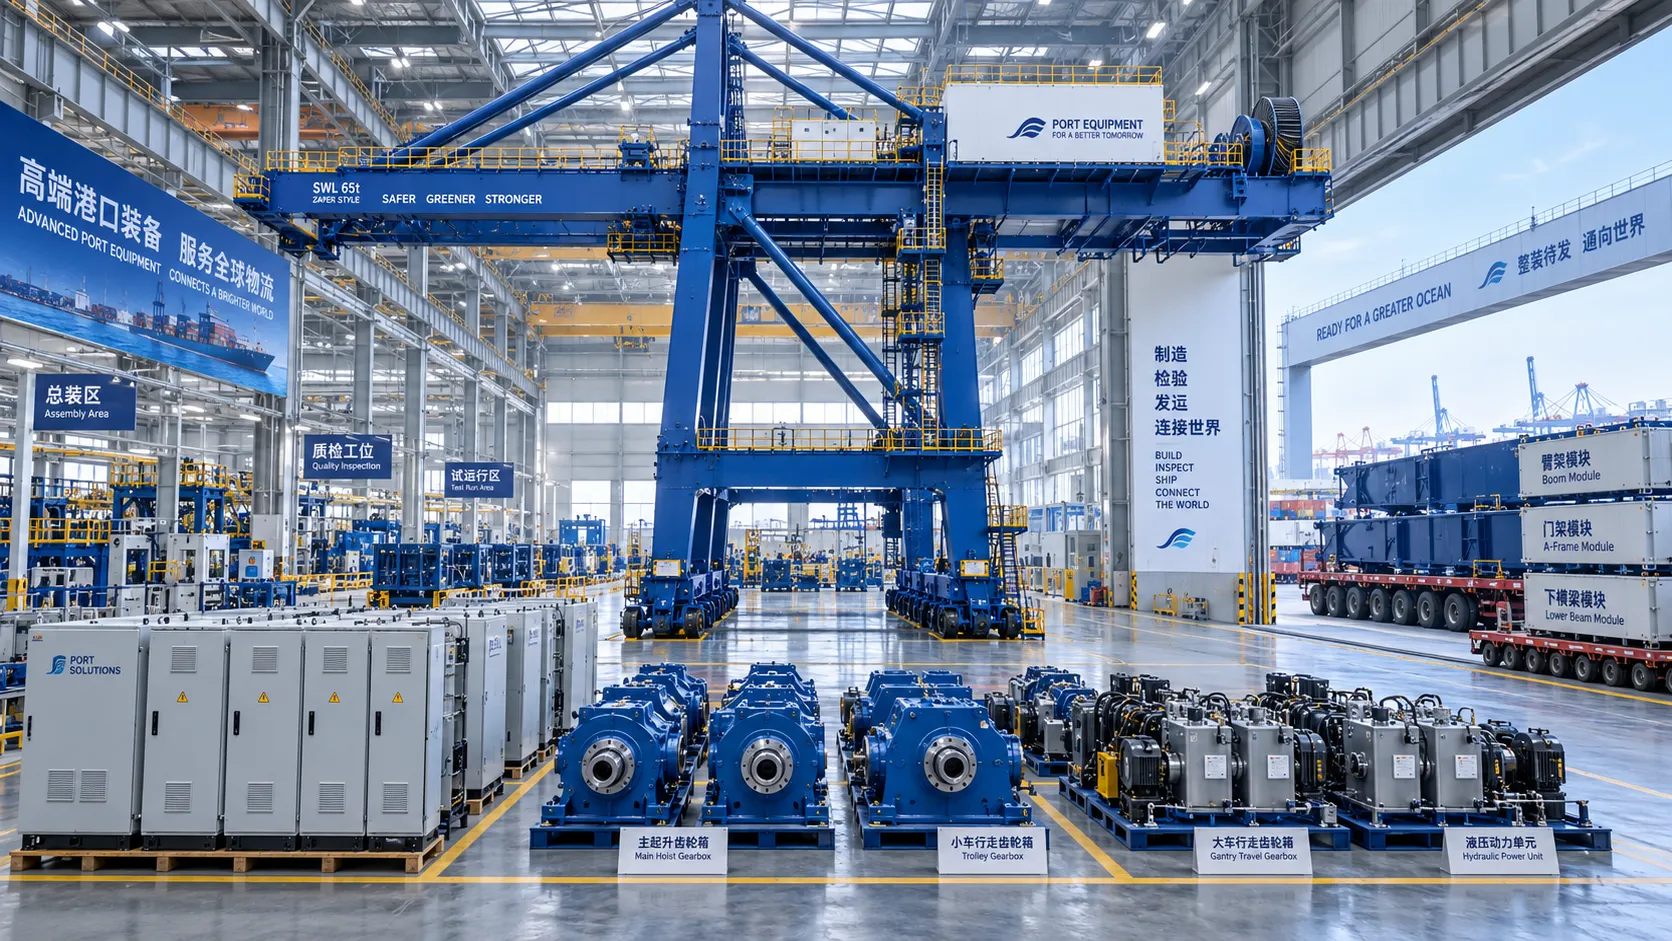
How Can Port Equipment Lead-Time Risk Be Managed?
How can port equipment lead-time risk be managed? Explore practical strategies to control critical paths, suppliers, transport, site readiness, and commissioning delays.
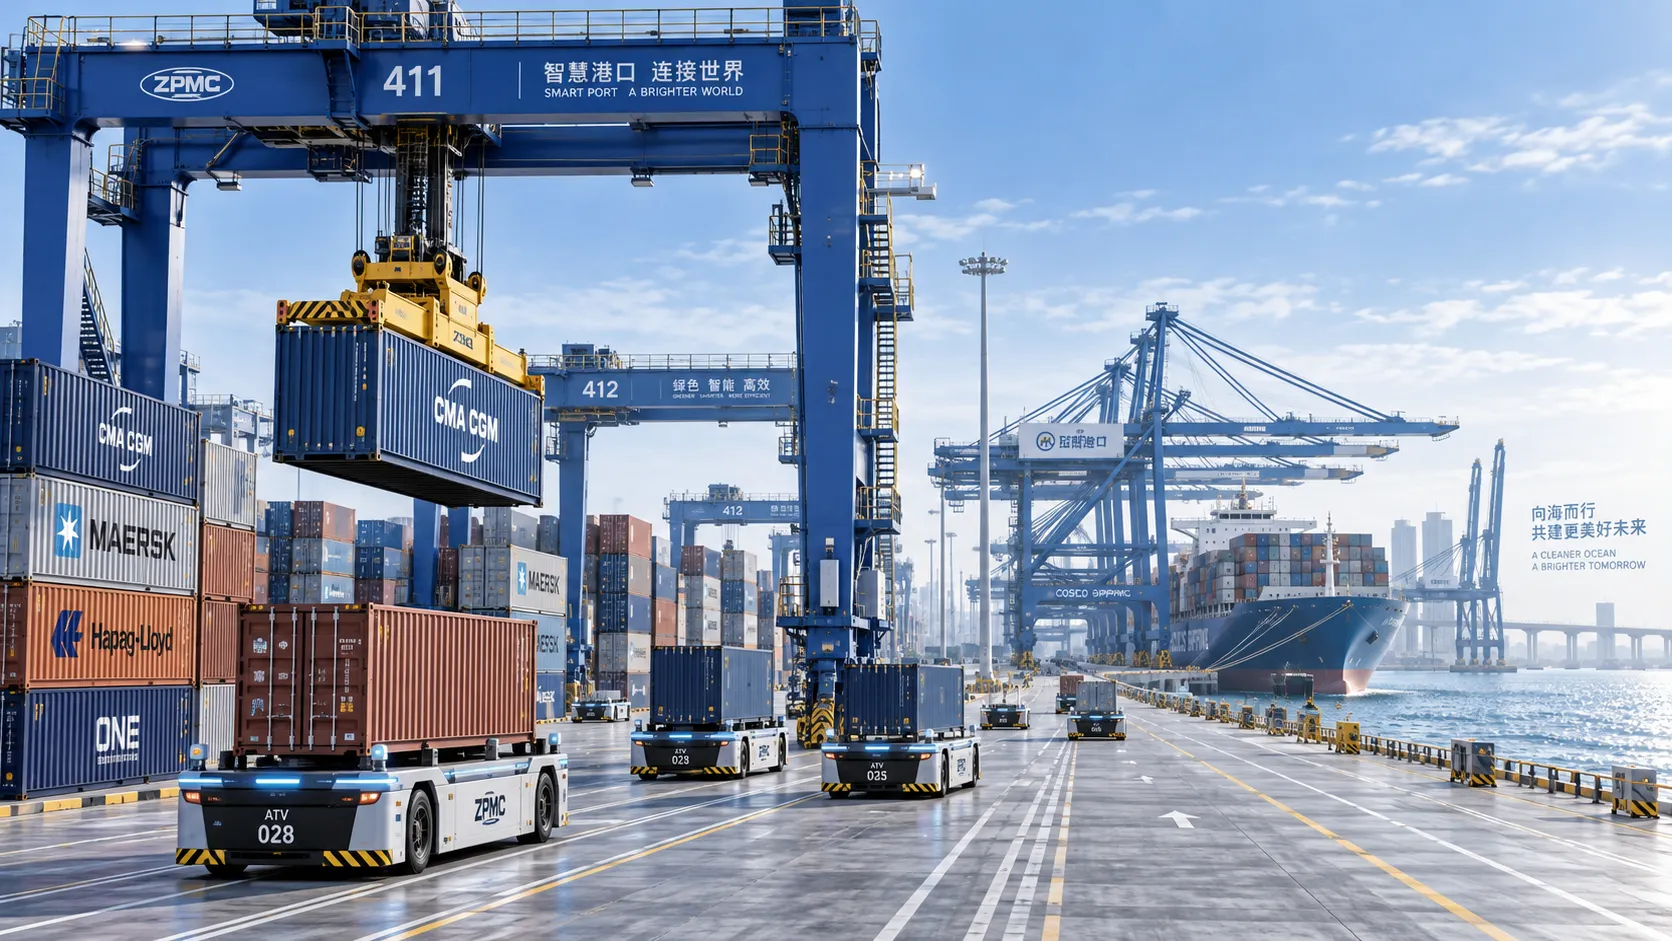
Terminal Automation Technologies That Raise Container Throughput Without Yard Disruption
Terminal automation technology that increases container throughput without disrupting yard flow. Explore smarter integration, resilient workflows, and phased deployment strategies.
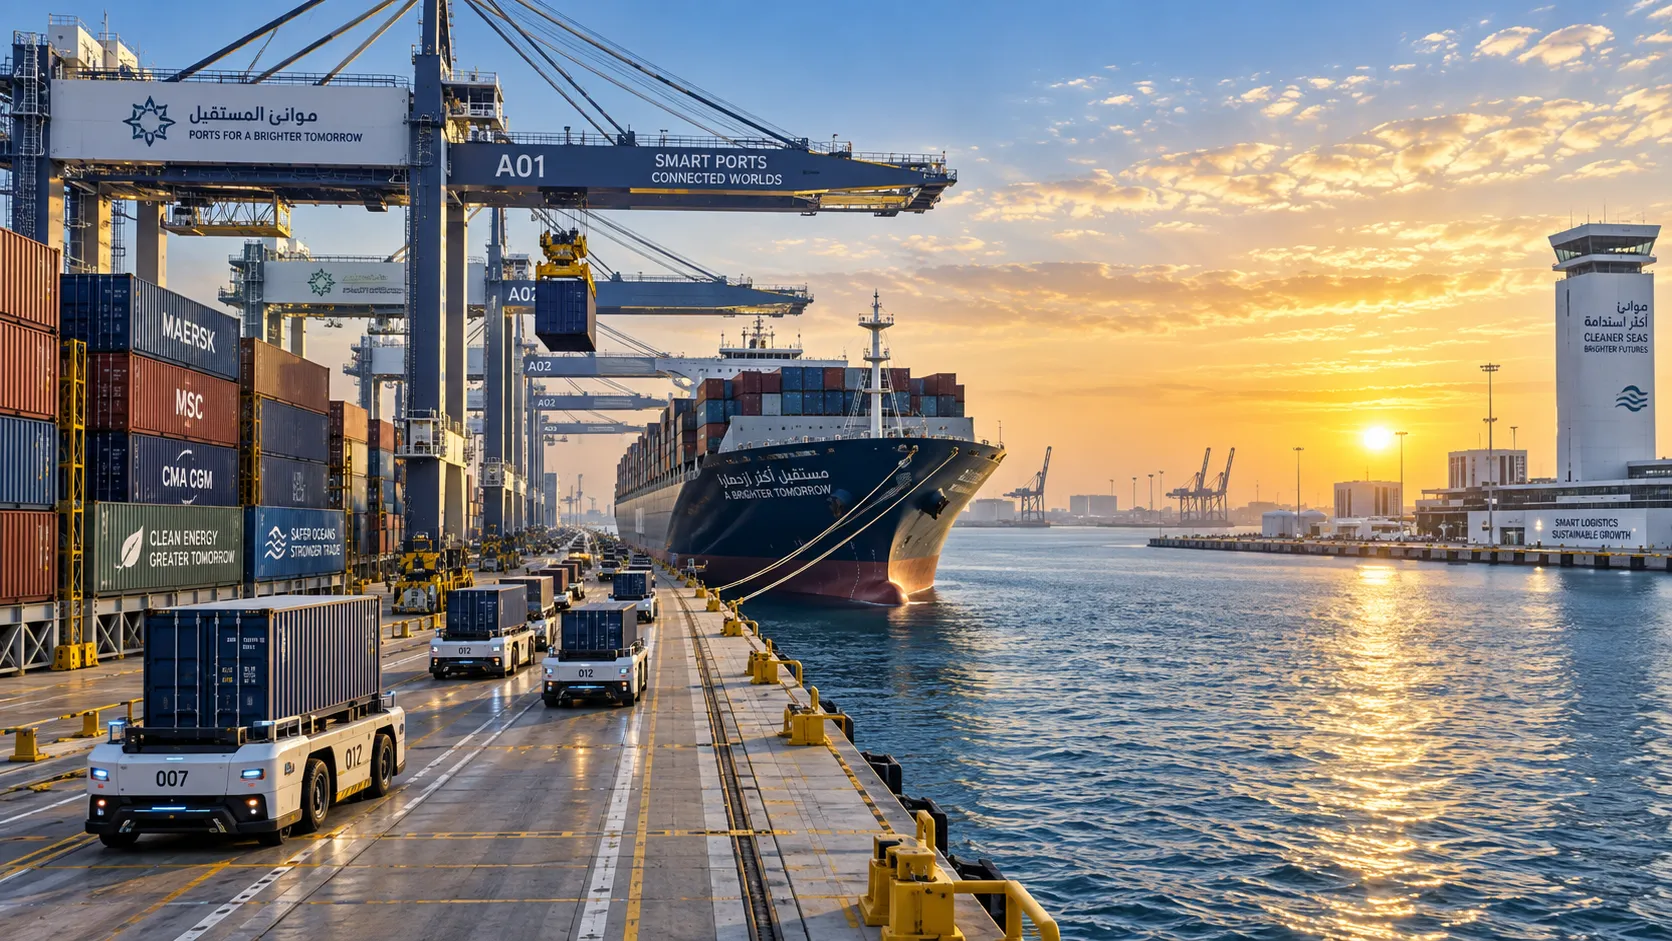
Middle East Port Automation: Key Market Drivers, Projects, and Investment Risks
Port automation systems Middle East: explore market drivers, flagship projects, integration challenges, and investment risks shaping smarter, resilient terminals.
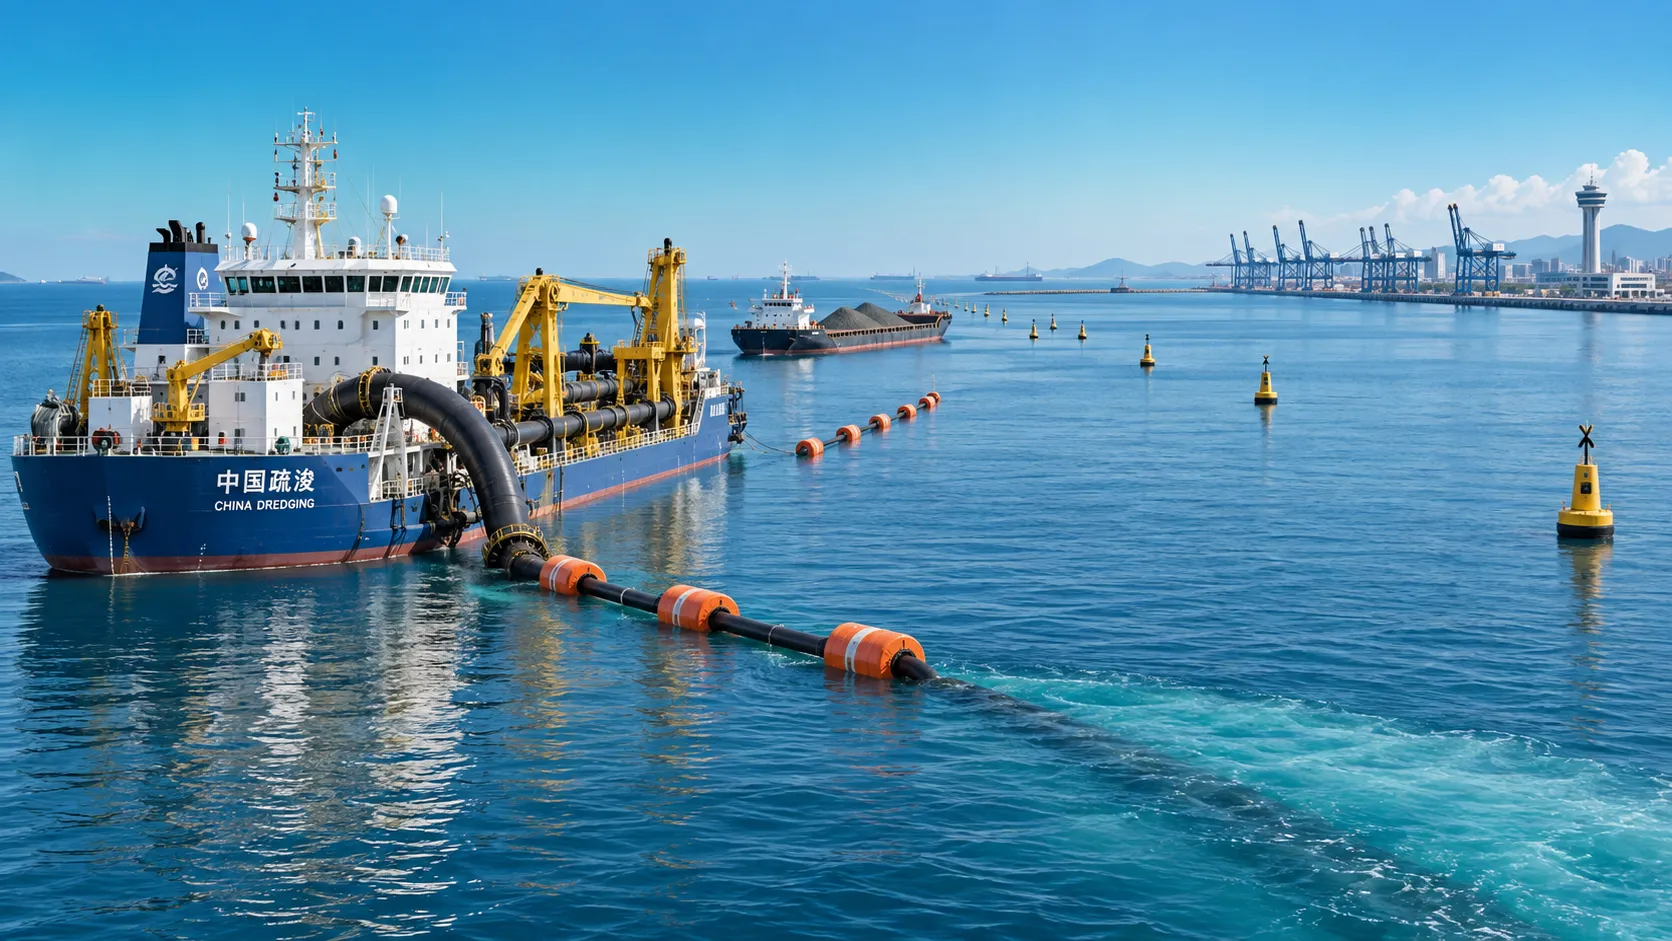
Planning Offshore Dredging Operations: Key Risks, Methods, and Project Controls
Offshore dredging operations demand smart planning. Explore key risks, proven methods, environmental controls, and project strategies for reliable delivery.