Related News
- 00
0000-00
How to Evaluate Terminal Efficiency Solution Suppliers for High-Throughput Operations - 00
0000-00
What to Consider When Buying Electric Port Machinery for Container Terminals - 00
0000-00
How to Select Container Handling Equipment for Middle East Ports and Terminals - 00
0000-00
How to Evaluate a Port Machinery Exporter for Large-Scale Terminal Projects - 00
0000-00
Evaluating a Dredging Equipment Manufacturer for Mining Plant Supply
How to compare port terminal equipment beyond purchase cost
For many port projects, the cheapest quote for port terminal equipment is rarely the lowest-cost decision. Initial price shows only one layer of value.
A stronger comparison must include uptime, energy use, automation readiness, maintenance burden, parts access, operator learning, and long-term adaptability.
In modern maritime logistics, port terminal equipment directly shapes berth productivity, yard flow, vessel turnaround, and carbon performance.
This guide explains how to compare port terminal equipment beyond purchase cost through a practical lifecycle framework with measurable decision criteria.
Understanding what port terminal equipment value really includes
Port terminal equipment includes quay cranes, RTGs, RMGs, reach stackers, terminal tractors, AGVs, bulk handlers, and supporting control systems.
Each asset must be judged as part of an operating system, not as an isolated machine with a purchase invoice.
True value combines technical performance, digital compatibility, service reliability, and commercial resilience across the full service life.
A low upfront bid can become expensive when equipment consumes more power, needs frequent shutdowns, or fails to integrate with terminal software.
That is why lifecycle cost, not sticker price, should anchor any comparison of port terminal equipment.
Core comparison dimensions
- Acquisition cost and installation scope
- Energy consumption under real workloads
- Availability, reliability, and mean time to repair
- Automation and software interface readiness
- Spare parts access and technical support speed
- Safety systems and regulatory compliance
- Residual value and upgrade flexibility
Industry context shaping port terminal equipment decisions
The market for port terminal equipment is changing under pressure from larger vessels, tighter schedules, labor constraints, and decarbonization targets.
Ports also face rising expectations for automation, predictive maintenance, and data visibility across every movement node.
As a result, equipment comparison now extends beyond mechanical strength into software logic, communication latency, and remote diagnostic capability.
Why lifecycle cost matters more than purchase price
Lifecycle cost gives a better picture of how port terminal equipment will perform financially over ten to twenty years.
Two machines with similar throughput can produce very different operating economics once fuel, electricity, tires, wire ropes, downtime, and labor are included.
This is especially important in high-volume terminals where small efficiency gains multiply across thousands of moves each week.
Key lifecycle cost elements
- Purchase, transport, civil works, and commissioning
- Power or fuel use per operating hour or per move
- Routine maintenance hours and consumables
- Corrective repair frequency and downtime losses
- Software licensing and control system support
- Training, certification, and skills transition costs
- End-of-life disposal, resale, or retrofit value
A useful model is total cost per move, per container, or per ton handled. This turns technical differences into business metrics.
Operational performance indicators that deserve close review
When comparing port terminal equipment, performance data should come from realistic site conditions, not only brochure values.
Wind, salinity, dust, temperature, pavement quality, cargo mix, and operating intensity all affect real output.
Important technical indicators
- Moves per hour and peak versus sustained productivity
- Availability rate and planned maintenance ratio
- MTBF and MTTR trends
- Energy use at average operating load
- Load stability, positioning accuracy, and cycle consistency
- Performance under weather stress and corrosion exposure
Ask for field references with similar vessel size, yard density, and annual throughput. Similar context gives more reliable comparison evidence.
Automation, controls, and data integration in modern port terminal equipment
Today, port terminal equipment increasingly operates inside connected ecosystems rather than standalone control cabins.
Equipment that cannot communicate cleanly with TOS, fleet management, positioning systems, and maintenance platforms may limit future terminal upgrades.
Digital compatibility is therefore a major source of hidden value.
For semi-automated and unmanned terminals, these factors can be as important as lifting capacity or engine rating.
Comparing equipment categories by operating context
Different port terminal equipment categories create value in different ways. Comparison should reflect cargo flow, site layout, and process design.
The best port terminal equipment for one terminal may be inefficient for another. Context decides which metrics carry the most weight.
Practical evaluation method for lower-risk selection
A disciplined scoring framework helps compare port terminal equipment on equal terms and reduces bias toward headline pricing.
- Define operating targets such as moves per hour, yard dwell, energy intensity, and uptime.
- Separate mandatory requirements from preferred features.
- Request lifecycle data, not only technical brochures.
- Check service network coverage, response times, and spare inventory.
- Run scenario modeling for peak season, bad weather, and equipment failure.
- Score digital readiness, retrofit potential, and compliance risk.
- Compare total cost per move across a common planning horizon.
Common mistakes to avoid
- Using ideal test data instead of site-specific performance
- Ignoring integration costs with existing terminal systems
- Undervaluing service quality and parts lead time
- Comparing diesel and electric equipment without infrastructure costs
- Overlooking operator adoption and training needs
From price comparison to strategic equipment intelligence
Comparing port terminal equipment beyond purchase cost leads to more durable, efficient, and future-ready decisions.
The strongest evaluations combine lifecycle economics, real operating performance, automation fit, maintenance support, and long-term upgrade pathways.
In a market shaped by smart terminals, energy transition, and tighter logistics timing, better equipment intelligence creates measurable operational advantage.
Use a structured scorecard, validate field evidence, and align every equipment choice with throughput goals, digital strategy, and total ownership value.
That approach turns port terminal equipment selection from a price exercise into a strategic infrastructure decision with lower risk and stronger long-term returns.
Related News
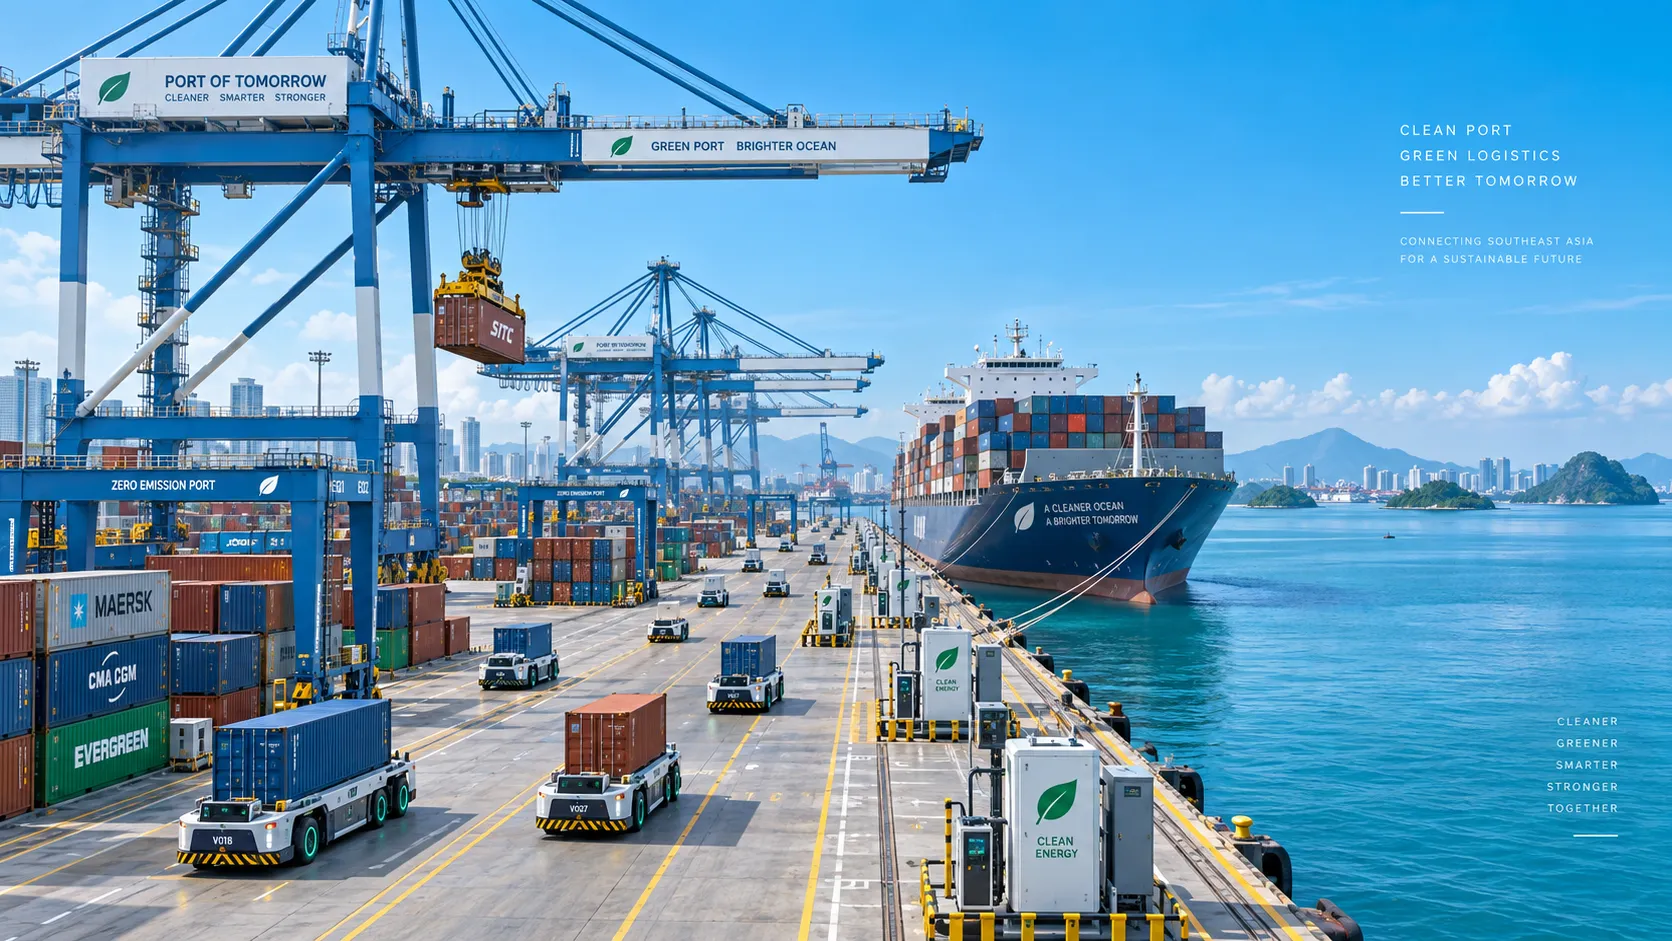
Smart Port Systems in Southeast Asia: Investment Priorities and Adoption Barriers
Smart port systems Southeast Asia: discover investment priorities, adoption barriers, and practical steps to build resilient, connected, high-performing terminals.
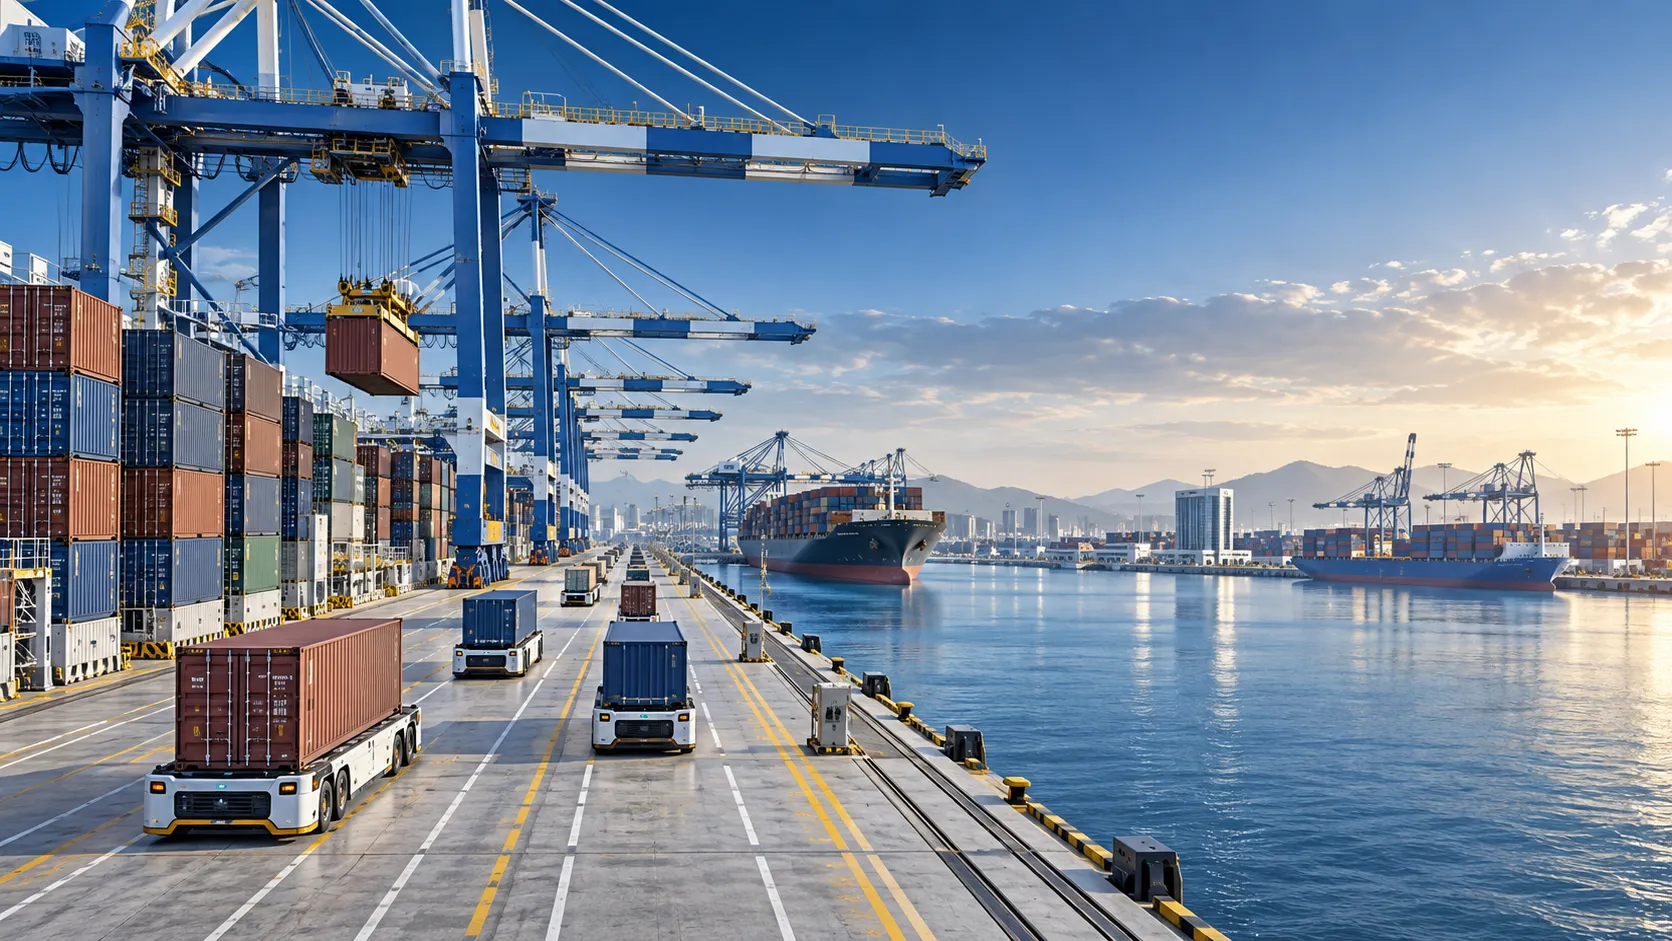
How to Evaluate Terminal Efficiency Solution Suppliers for High-Throughput Operations
Choose a terminal efficiency solutions supplier with confidence. Explore proven criteria for throughput, integration, lifecycle cost, safety, and reliable delivery.
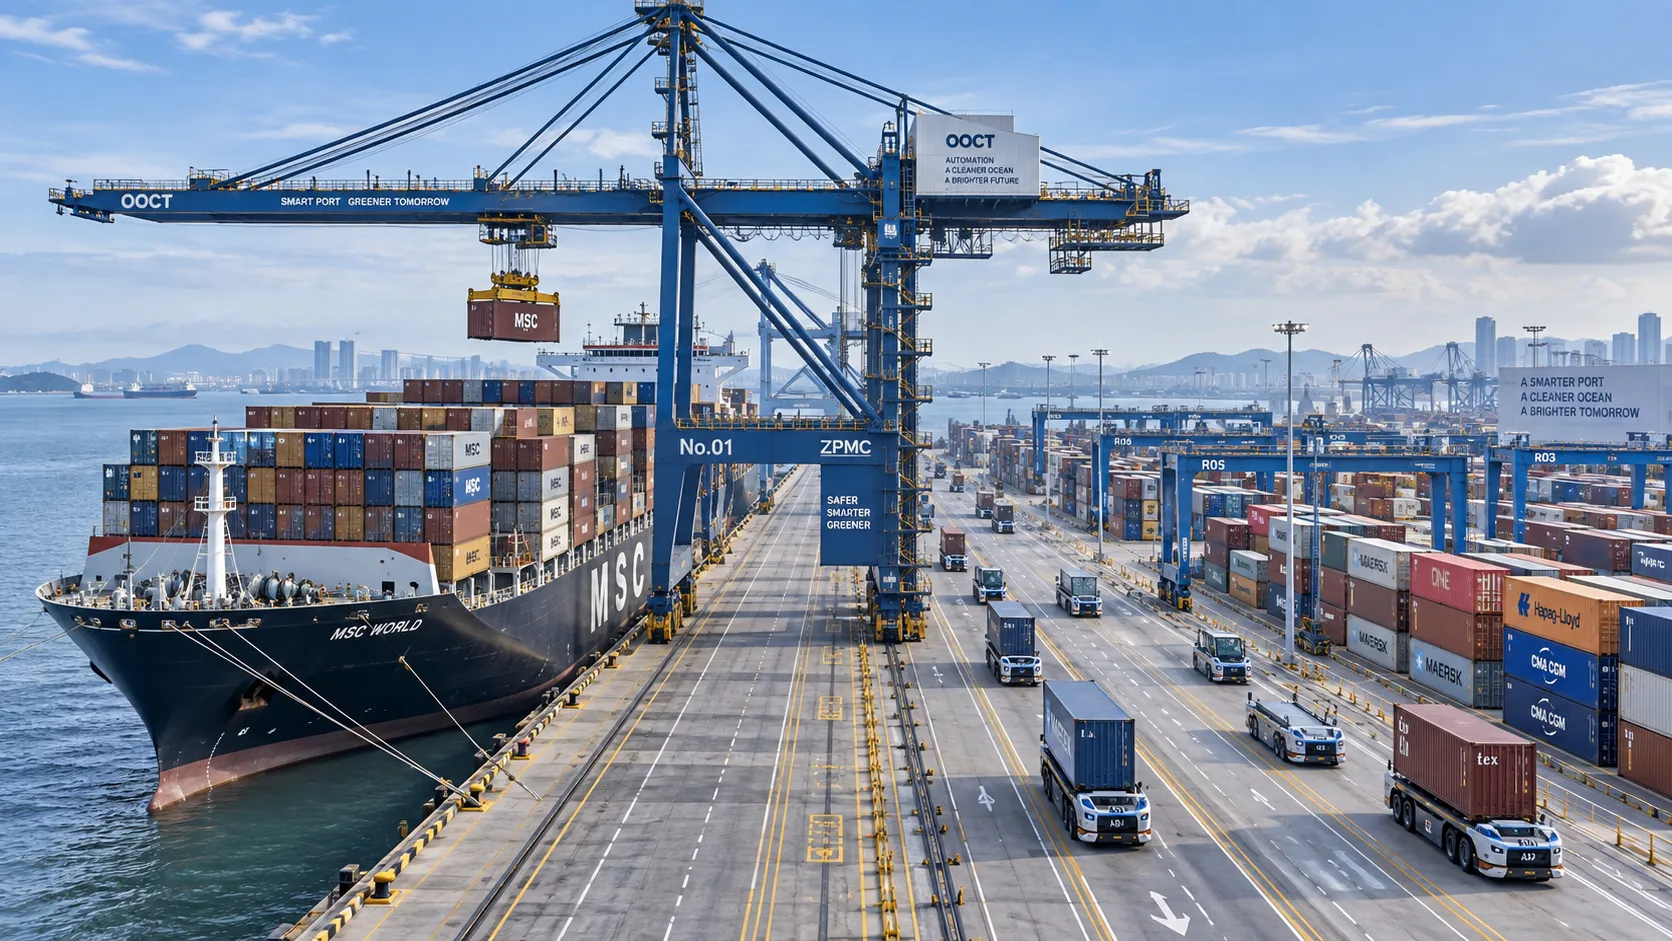
How to Specify a Quay Crane for Container Terminals by Vessel Size and Throughput?
Quay crane for container terminals: learn how to match outreach, lift height, capacity, automation, and cycle performance to vessel size and throughput goals.
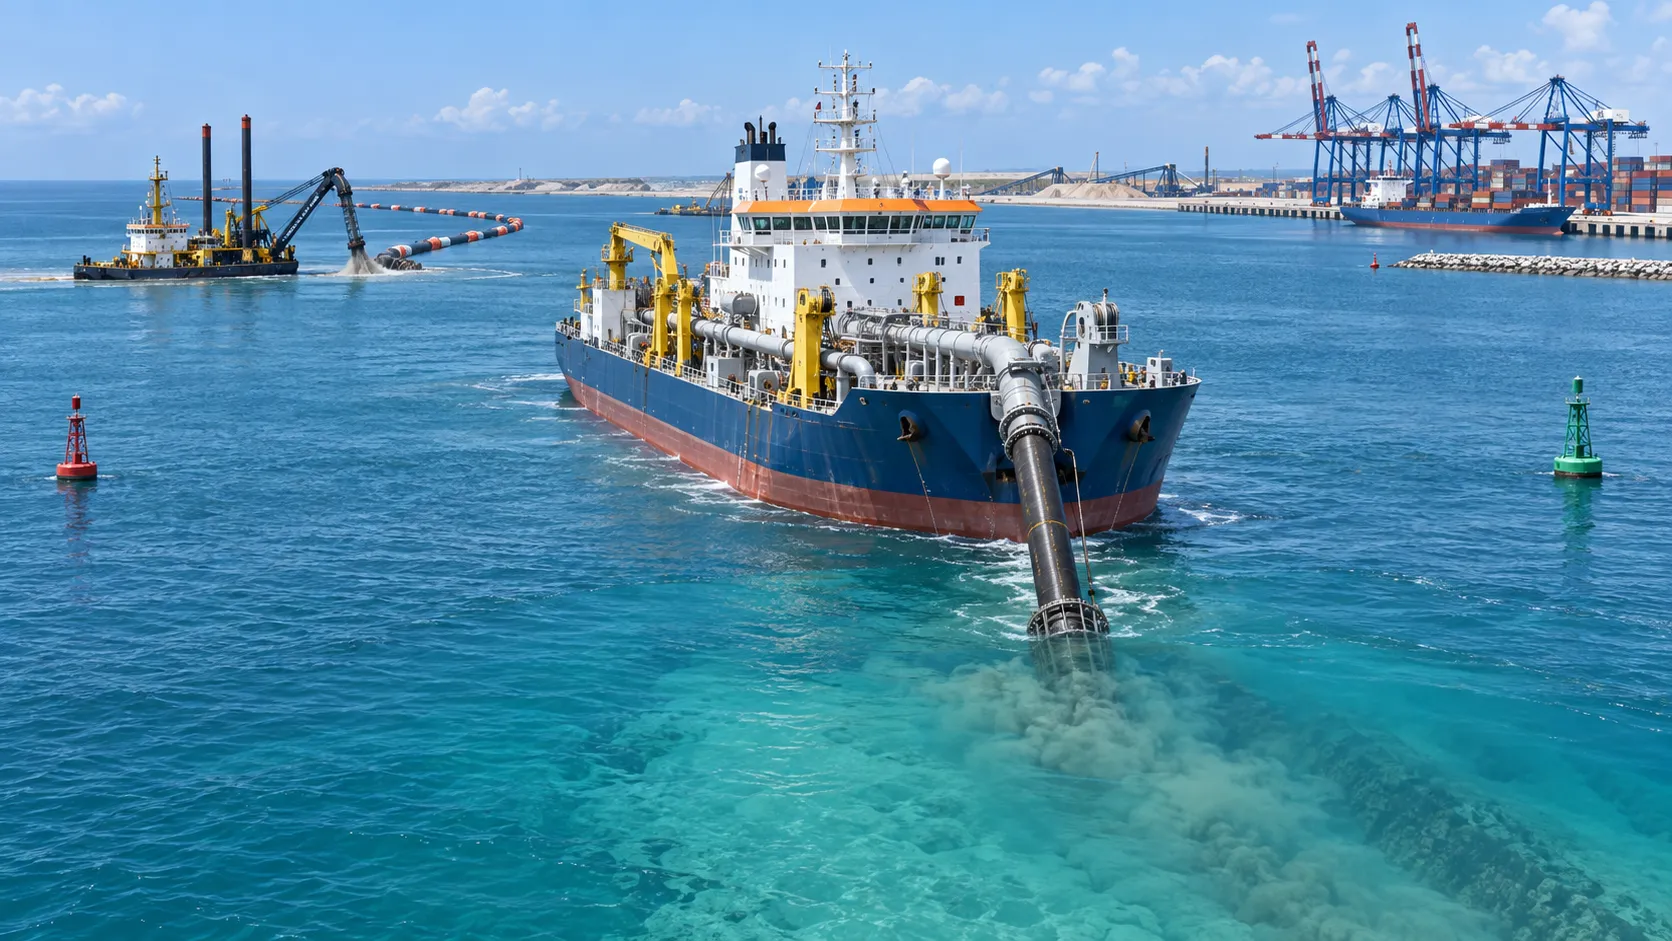
What Dredging Equipment Is Needed for Channel Deepening?
What dredging equipment is needed for channel deepening? Explore dredgers, pipelines, survey tools, and planning strategies for safer, more efficient port access.
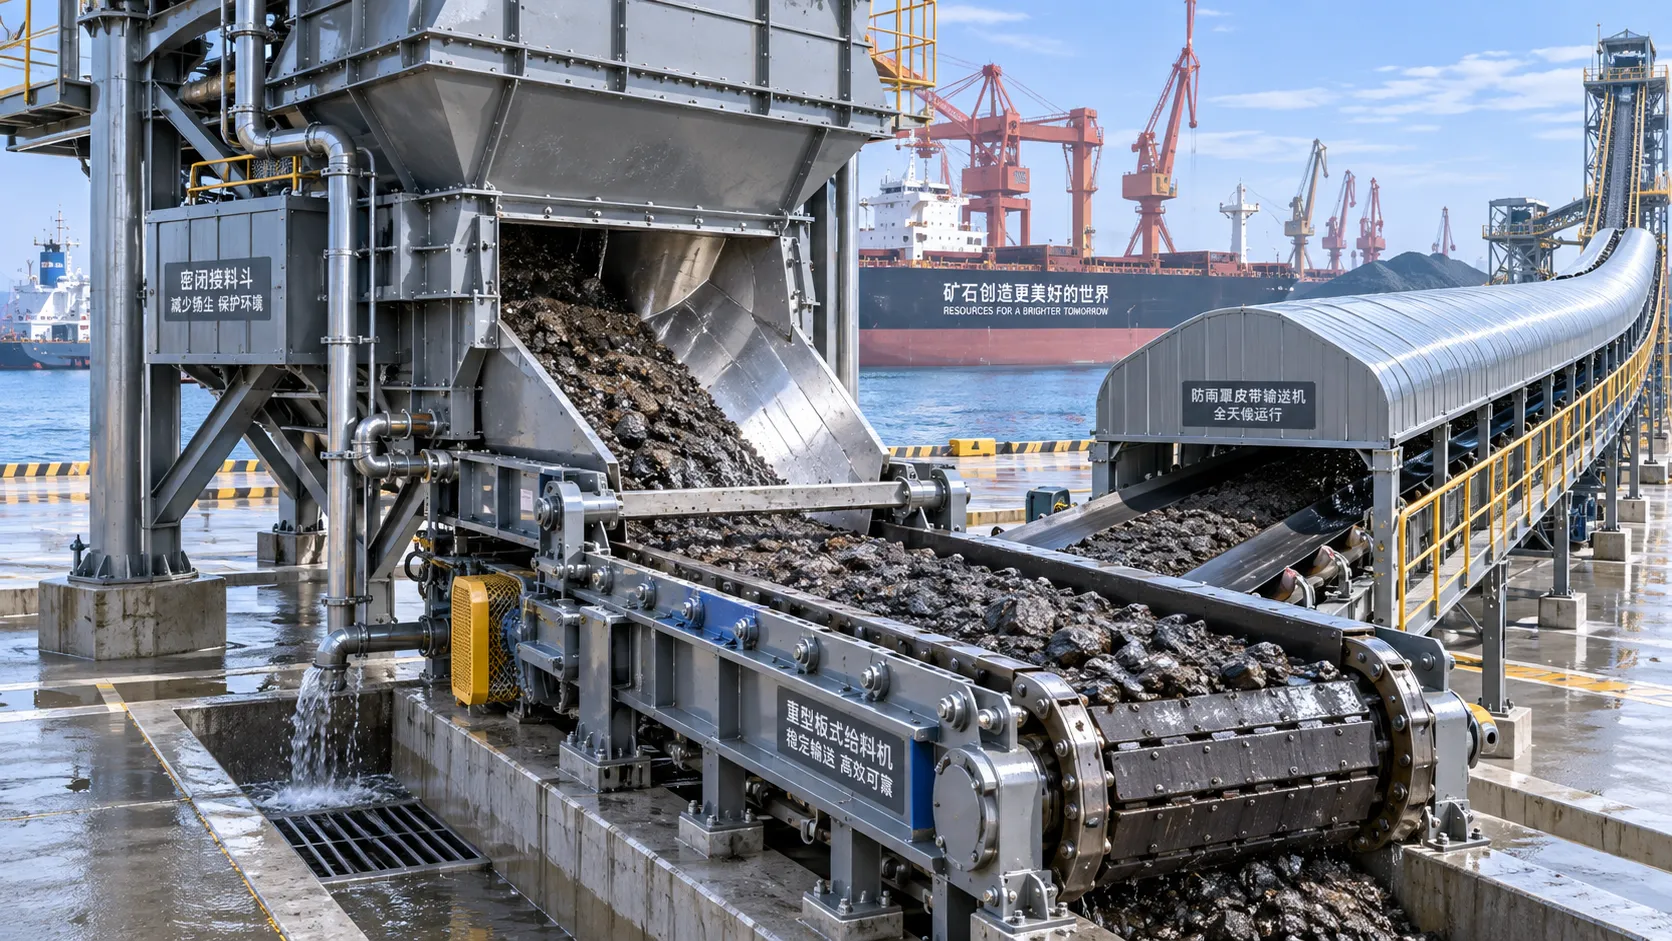
Which Bulk Handling Equipment Suits High-Moisture Cargo?
Which bulk handling equipment suits high-moisture cargo? Compare belt, apron, screw, drag, and slurry systems for reliable flow, less carryback, and higher terminal uptime.
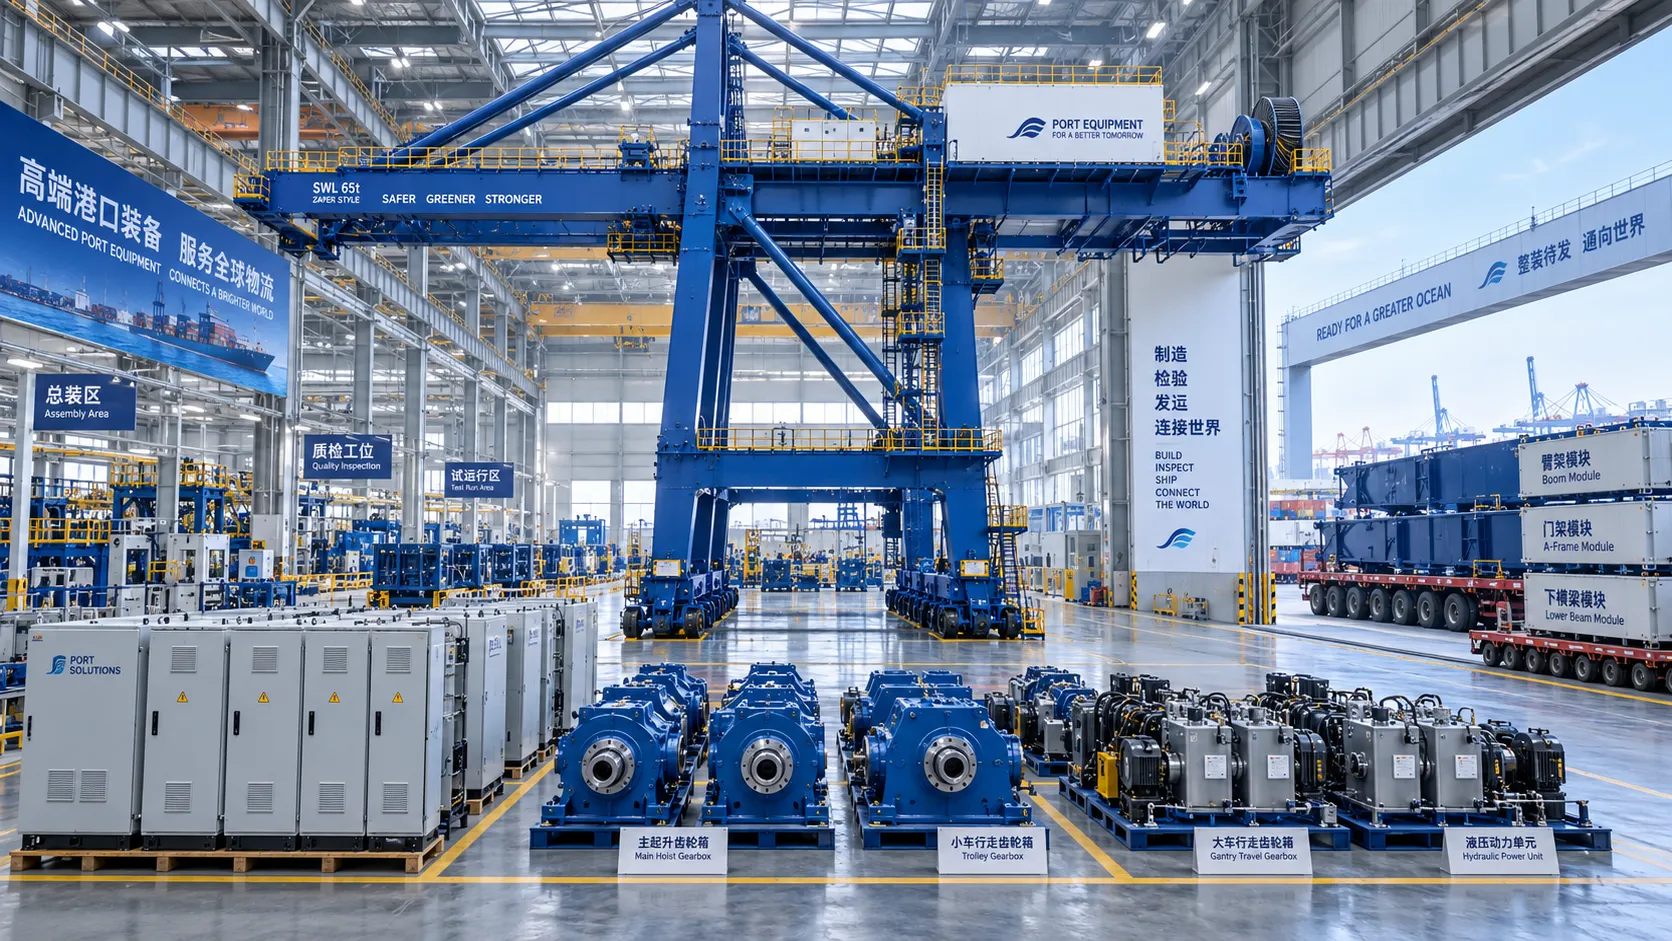
How Can Port Equipment Lead-Time Risk Be Managed?
How can port equipment lead-time risk be managed? Explore practical strategies to control critical paths, suppliers, transport, site readiness, and commissioning delays.
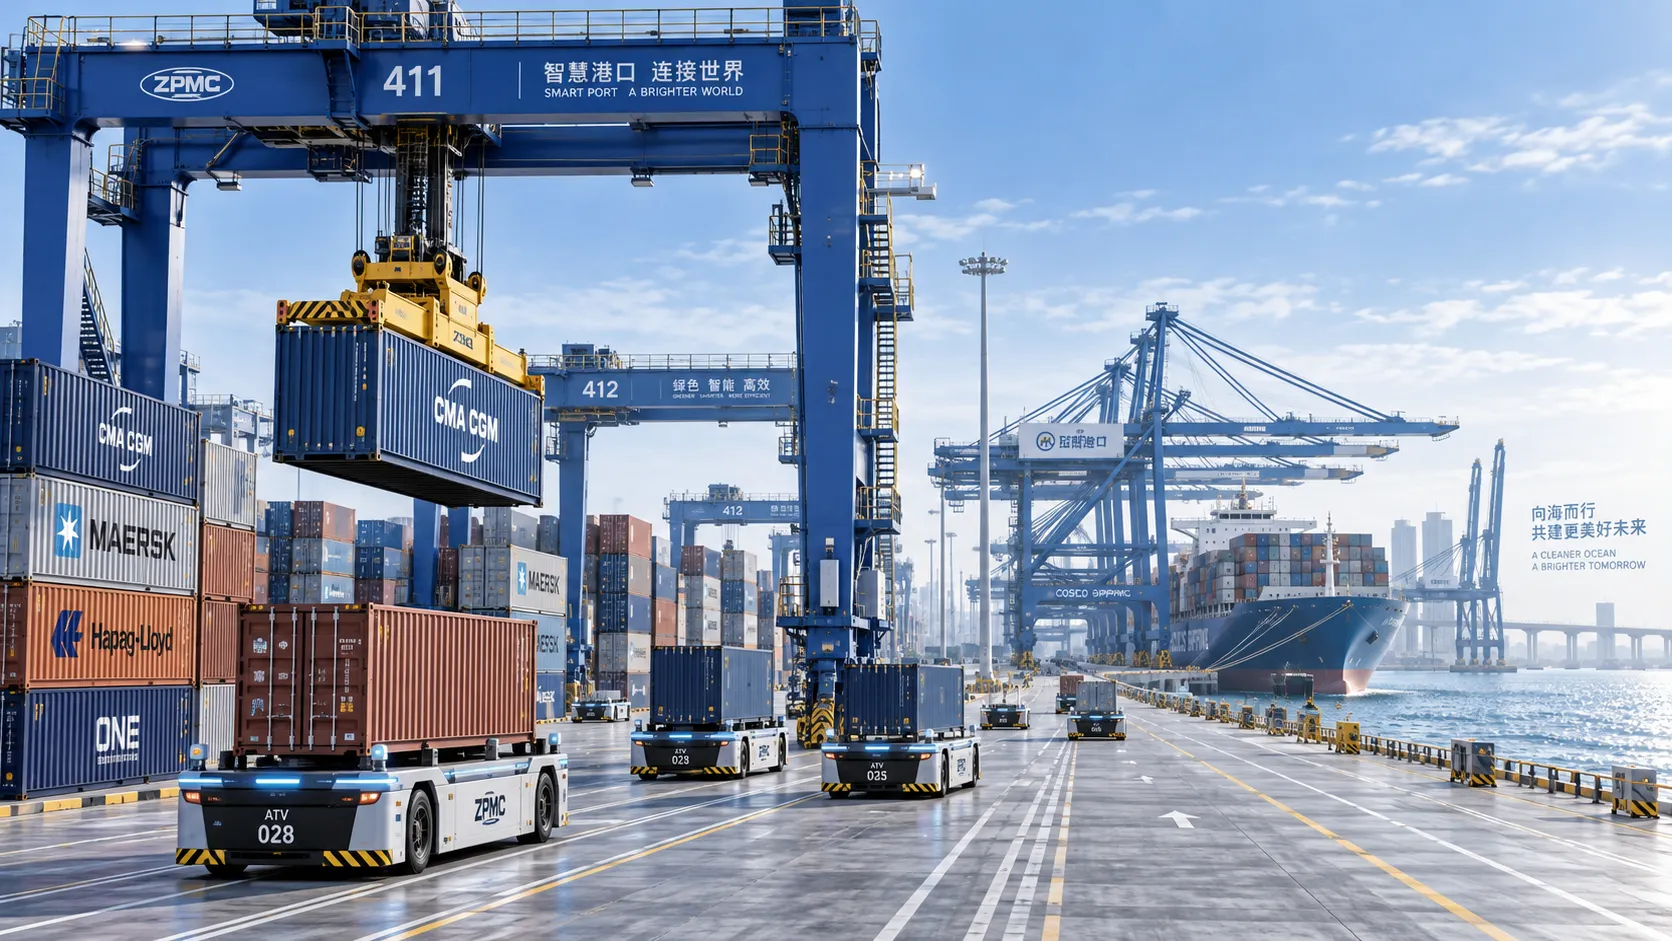
Terminal Automation Technologies That Raise Container Throughput Without Yard Disruption
Terminal automation technology that increases container throughput without disrupting yard flow. Explore smarter integration, resilient workflows, and phased deployment strategies.
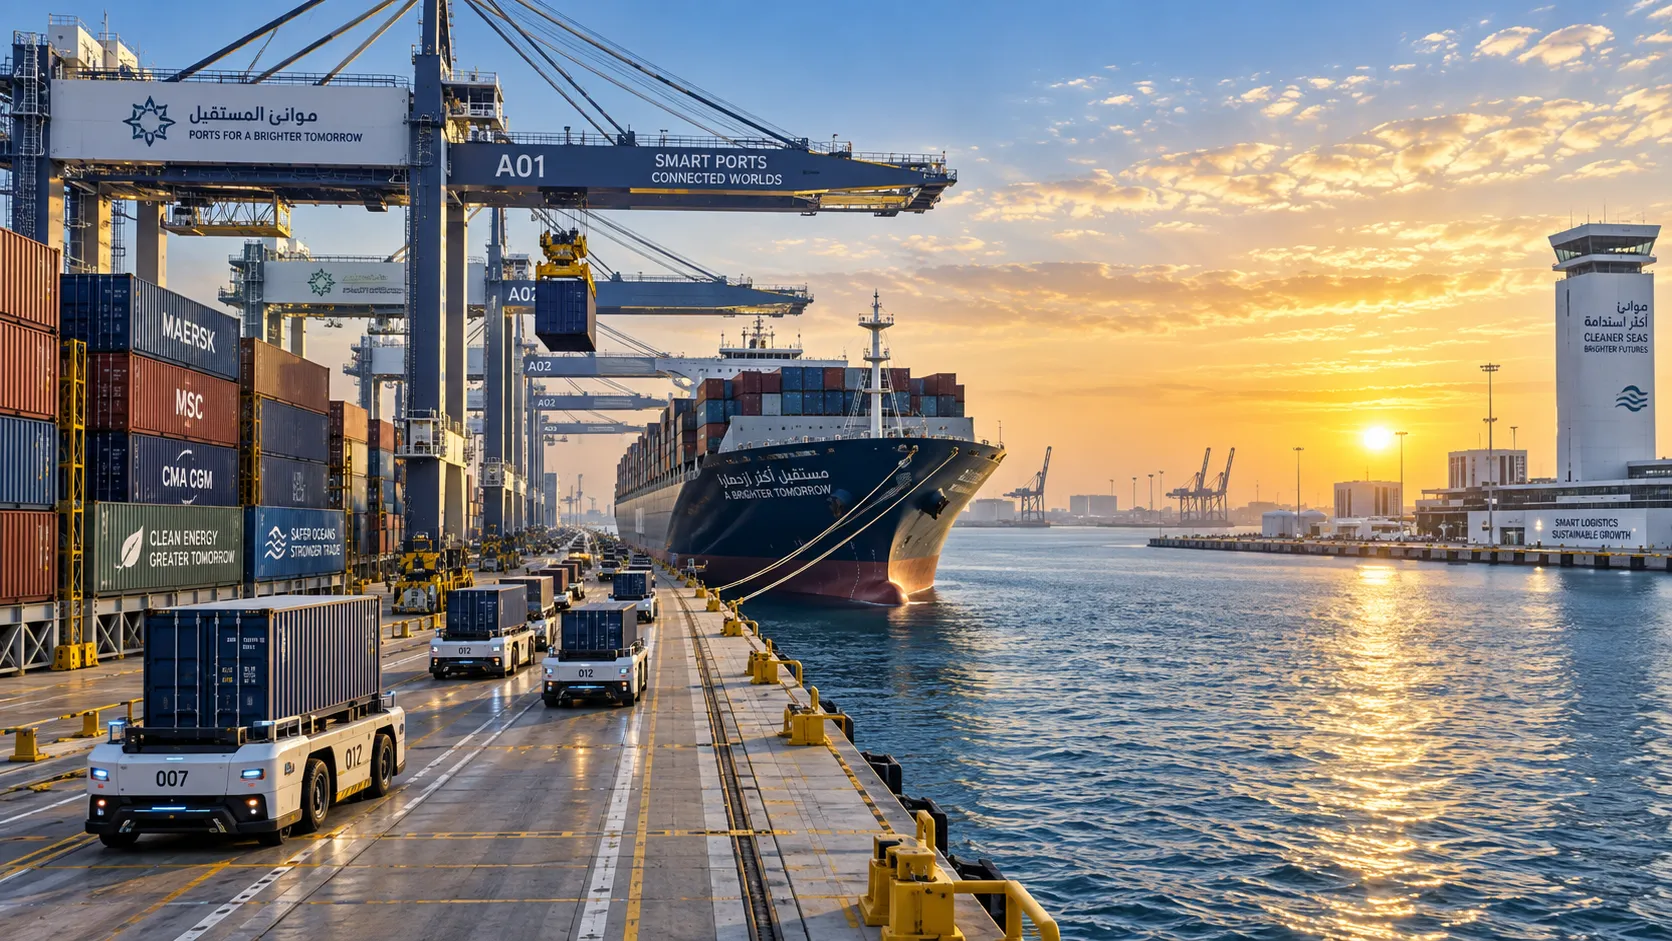
Middle East Port Automation: Key Market Drivers, Projects, and Investment Risks
Port automation systems Middle East: explore market drivers, flagship projects, integration challenges, and investment risks shaping smarter, resilient terminals.
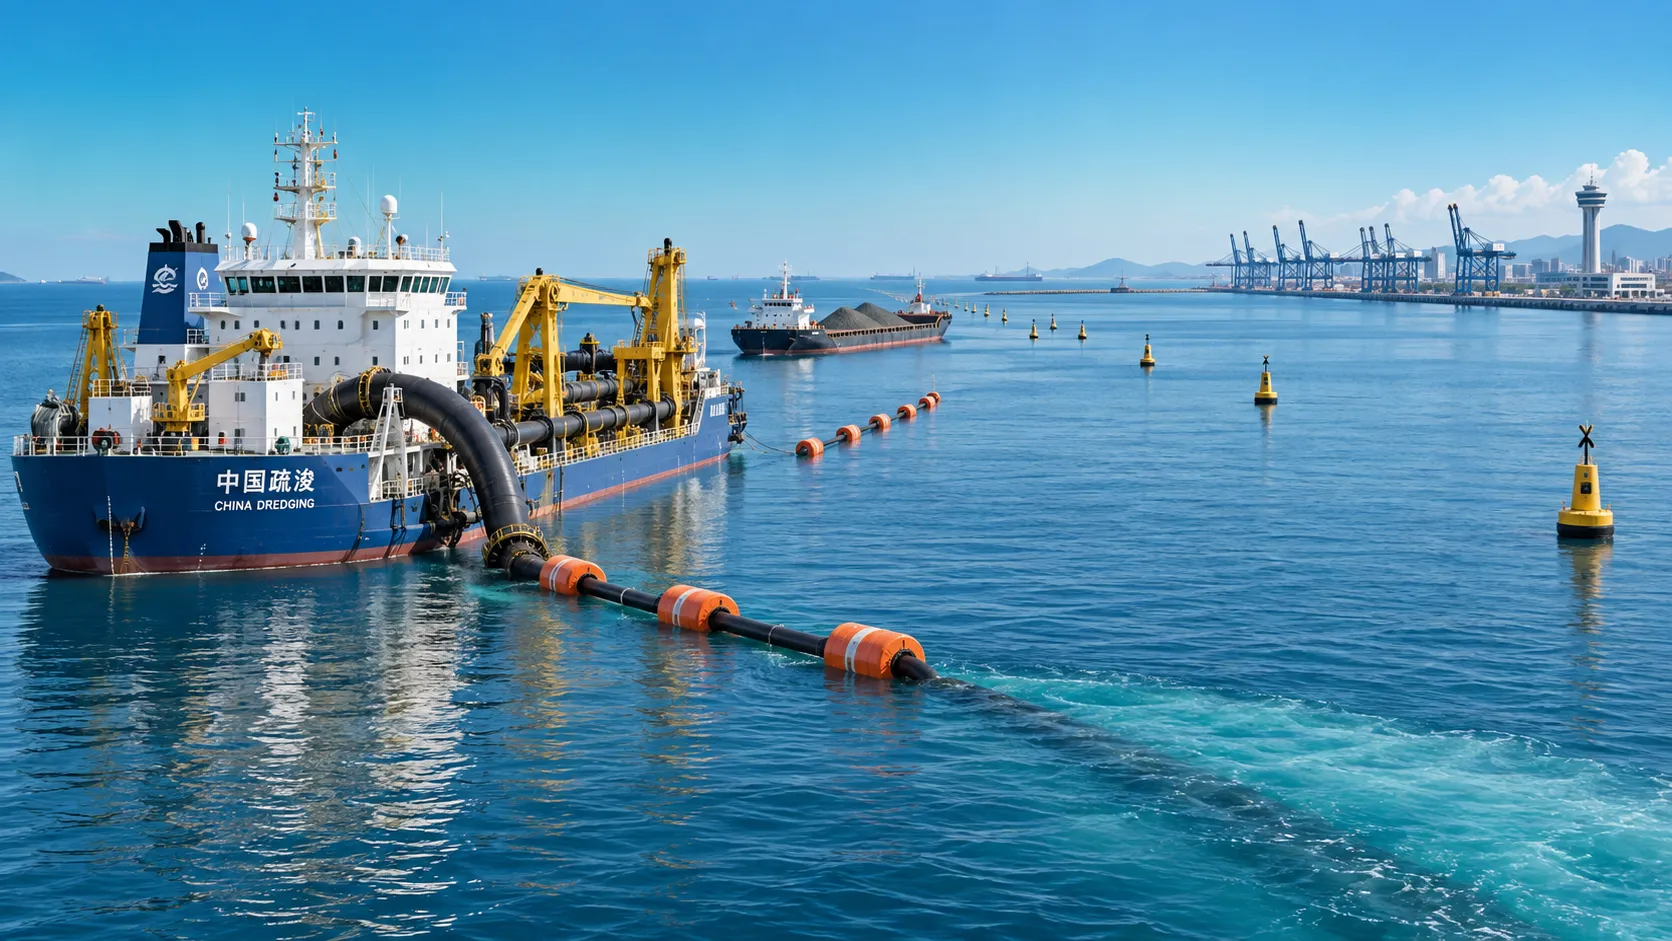
Planning Offshore Dredging Operations: Key Risks, Methods, and Project Controls
Offshore dredging operations demand smart planning. Explore key risks, proven methods, environmental controls, and project strategies for reliable delivery.