Related News
- 00
0000-00
Smart Port Systems Pricing: How to Compare Lifecycle Costs and ROI by Terminal Scale - 00
0000-00
What Drives Bulk Material Handling Pricing in Large Conveyor System Projects? - 00
0000-00
How Shipping Rate Analytics in Europe Help Importers Predict Costs and Route Risk - 00
0000-00
What Buyers Check When Reviewing Used PVC Coating Line Output and Condition - 00
0000-00
Automated Port Systems Cost Breakdown: CAPEX, Integration, and Maintenance Factors
How Shipping Rate Analytics in Europe Help Importers Predict Costs and Route Risk
Why Shipping Rate Analytics in Europe Is More Than a Freight Price Dashboard
For commercial evaluators navigating volatile trade corridors, shipping rate analytics Europe offers a sharper way to predict landed costs, identify route risk, and compare port-to-port performance before contracts are signed. By combining freight pricing signals with terminal efficiency, congestion patterns, and broader maritime intelligence, importers can move beyond reactive budgeting and make more confident sourcing, routing, and timing decisions in an increasingly complex European logistics environment.
The phrase is often misunderstood. Many buyers hear “rate analytics” and think of a chart that tracks spot prices from Asia to Rotterdam or North Europe to the Mediterranean. That is only the visible layer. In practice, shipping rate analytics in Europe is a decision framework that links freight pricing to operational realities: berth congestion, inland bottlenecks, schedule reliability, transshipment exposure, port labor conditions, canal disruptions, emissions-related compliance costs, and the availability of equipment. A rate that looks attractive in isolation may become expensive once delay risk, demurrage exposure, feeder dependency, or last-minute re-routing enters the picture.
This matters more in Europe than many importers initially assume. European logistics is not one uniform market. The region contains deep-sea gateways, short-sea networks, rail-dependent inland corridors, highly automated terminals, older constrained port layouts, and a regulatory environment that increasingly affects shipping economics. A shipment routed through Antwerp-Bruges, Rotterdam, Hamburg, Valencia, Piraeus, or Gdansk is not just moving through different ports; it is moving through different operational ecosystems. The freight rate is therefore only one expression of a broader system cost.
What Importers Are Actually Trying to Predict
Most importers are not trying to guess the exact market rate on a single day. They are trying to answer a more useful commercial question: what will this lane really cost us, how likely is disruption, and which routing option gives the best balance between price and reliability?
That changes how analytics should be read. A procurement team comparing two carriers into Northern Europe may see one offer that is lower by a modest amount. If that service has weaker schedule integrity, more transshipment steps, or a higher chance of container dwell due to terminal pressure, the nominal saving can disappear quickly. The same applies when choosing between a major hub port and a secondary gateway. Hub ports may offer frequency and equipment availability, but under stress they can also concentrate congestion risk. Secondary ports can sometimes reduce inland mileage or avoid peak bottlenecks, but only if feeder links, customs handling, and onward transport capacity are dependable.
So the core output of shipping rate analytics Europe is not a single number. It is a cost-risk view. Strong analysis usually looks at at least five dimensions together: base ocean freight, surcharges and seasonal adjustments, transit-time stability, port handling conditions, and inland continuation risk. When one of those is missing, the forecast becomes too neat to be commercially useful.
Why European Route Risk Has Become Harder to Read
European routes used to be evaluated with a relatively simple hierarchy: mainline port selection, inland haulage cost, and expected transit days. That model is less reliable now. Trade patterns shift faster, vessel networks are adjusted more aggressively, and infrastructure performance varies with labor availability, energy costs, water levels, and geopolitical rerouting. Even when a carrier quote looks stable, the conditions underneath it may not be.
One important reason is that terminal performance increasingly shapes freight economics. A port with advanced automation, better yard planning, and stronger equipment deployment can absorb volume shocks more effectively than a port operating closer to physical or labor limits. For a platform like PS-Nexus, which sits close to the worlds of heavy terminal gear, automated container handling, and marine infrastructure, this is not a side issue. Crane intensity, yard density, gate fluidity, and dredging-supported channel capacity all influence whether a route remains commercially predictable.
That connection is often missed by non-operational buyers. They may treat freight volatility as purely a carrier pricing problem, when part of the volatility comes from infrastructure behavior. If a terminal cannot sustain vessel exchange speed, if yard equipment is stretched, or if access channels impose constraints, schedule risk rises and rate behavior tends to follow. In other words, operational friction often shows up later as pricing noise.
The Signals That Matter More Than Average Rate Trends
Average lane pricing is useful, but it is rarely enough for evaluation work. Better decisions come from reading the signals around the rate, not only the rate line itself.
- Schedule reliability: a lower-priced service with unstable arrivals can create stock risk, buffer inventory cost, or missed delivery penalties.
- Port congestion indicators: waiting time, berth pressure, and yard turnover affect both transit confidence and ancillary charges.
- Transshipment dependence: every additional handling node introduces another point of delay, especially when feeder links are tight.
- Equipment availability: tight container supply or repositioning imbalance can distort quoted prices or make bookings less reliable than they appear.
- Inland network resilience: rail disruptions, trucking shortages, and barge constraints can undermine a port choice that looked efficient on paper.
- Regulatory and emissions cost pass-through: in Europe, compliance-related cost structures deserve attention, even when they are not the headline line item in an initial quote.
For commercial assessment, these signals help separate a cheap route from a durable route. The distinction is not academic. Procurement teams that lock decisions too early on headline freight can underestimate total exposure, especially in categories where timing affects factory continuity, seasonal sales windows, or project delivery milestones.
A Useful Way to Read Port-to-Port Comparisons
Port comparisons in Europe are often framed too narrowly. Importers ask which port is cheaper, when the better question is which port is cheaper for this cargo profile, this inland destination, and this tolerance for delay. The answer can change materially depending on whether the goods are high-value consumer inventory, industrial components, project cargo support material, or lower-urgency replenishment stock.
For example, a major North Range gateway may offer dense carrier coverage and competitive linehaul pricing, but the commercial value depends on what happens after discharge. If inland distribution relies on a corridor facing recurring rail strain or trucking imbalance, the importer should treat the ocean rate as incomplete information. By contrast, a route with a slightly higher sea leg cost may produce a lower end-to-end cost if port handling is smoother and onward transport is more stable.
This is where maritime intelligence becomes more sophisticated than rate benchmarking. It starts asking operationally grounded questions: Is the port’s handling system likely to absorb peak arrivals? Are yard and gate systems efficient enough to protect container flow? Is the dredged access and nautical window supportive of vessel consistency? Are automation and control systems reducing variability, or is the network still vulnerable to labor-intensive chokepoints? Those are not engineering curiosities. They are commercial variables.
Common Misreadings in Shipping Rate Analysis
One common mistake is assuming that a declining rate index automatically improves buying conditions. It may signal weaker demand, but it can also mask service rationalization, blank sailings, or network restructuring that reduces flexibility. Lower rates do not always mean lower execution risk.
Another is treating Europe as a single destination market. An importer landing cargo in Southern Europe for Central European consumption faces a different exposure profile from one shipping directly into a North Sea gateway. Geography, feeder architecture, customs handling patterns, and inland infrastructure all affect outcome.
A third misreading is to look at freight history without checking asset-side conditions. Port automation maturity, terminal equipment deployment, yard operating model, and channel maintenance standards can all influence whether a route behaves consistently under stress. Organizations that follow heavy terminal gear and dredging engineering closely tend to see this earlier than teams that only watch rate dashboards.
How Better Analytics Supports Commercial Decisions Before Contracting
The practical use case is straightforward. Before committing to a supplier, a seasonal buying window, or a routing structure, evaluators need to model cost under realistic operating conditions. That means testing more than one scenario: a stable-flow scenario, a congestion scenario, and a disruption scenario. The purpose is not to predict every shock; it is to know which routes remain tolerable when the market stops behaving normally.
In procurement terms, shipping rate analytics Europe helps answer whether a contract should be fixed or flexible, whether inventory buffers need adjustment, whether a split-port strategy is justified, and whether a lower unit purchase price from one origin still holds after logistics volatility is included. That is particularly relevant for businesses with long replenishment cycles, tender-based sourcing, or imported components tied to production uptime.
For firms working across maritime logistics, coastal infrastructure, and equipment-led trade intelligence, the real value lies in combining commercial and technical observation. Rate behavior tells you what the market is charging. Port and terminal intelligence helps explain why the market is charging it, and whether that condition is temporary, structural, or likely to migrate to another corridor.
What a Serious Evaluation Should Include
A sound review of European shipping cost trends should not stop at spot movement charts. It should include lane-specific rate direction, surcharge transparency, service design, terminal handling context, and inland network compatibility. It should also distinguish between volatility that comes from cyclical pricing and volatility that comes from operating constraints. Those two risks behave differently and should not be priced the same way in a sourcing decision.
When importers start using analytics this way, they usually become less interested in finding the cheapest published rate and more interested in finding the route that keeps commercial assumptions intact. That is a healthier standard. In European trade, where port capability, network design, infrastructure quality, and regulatory pressure all intersect, cost prediction is really about understanding the mechanics behind the quote.
That is the practical meaning of shipping rate analytics Europe. It is not a narrow pricing tool. It is a way to read freight markets through the combined lens of maritime operations, terminal performance, and route resilience, so that landed cost estimates reflect the real behavior of the network rather than the optimism of a single booking screen.
Related News
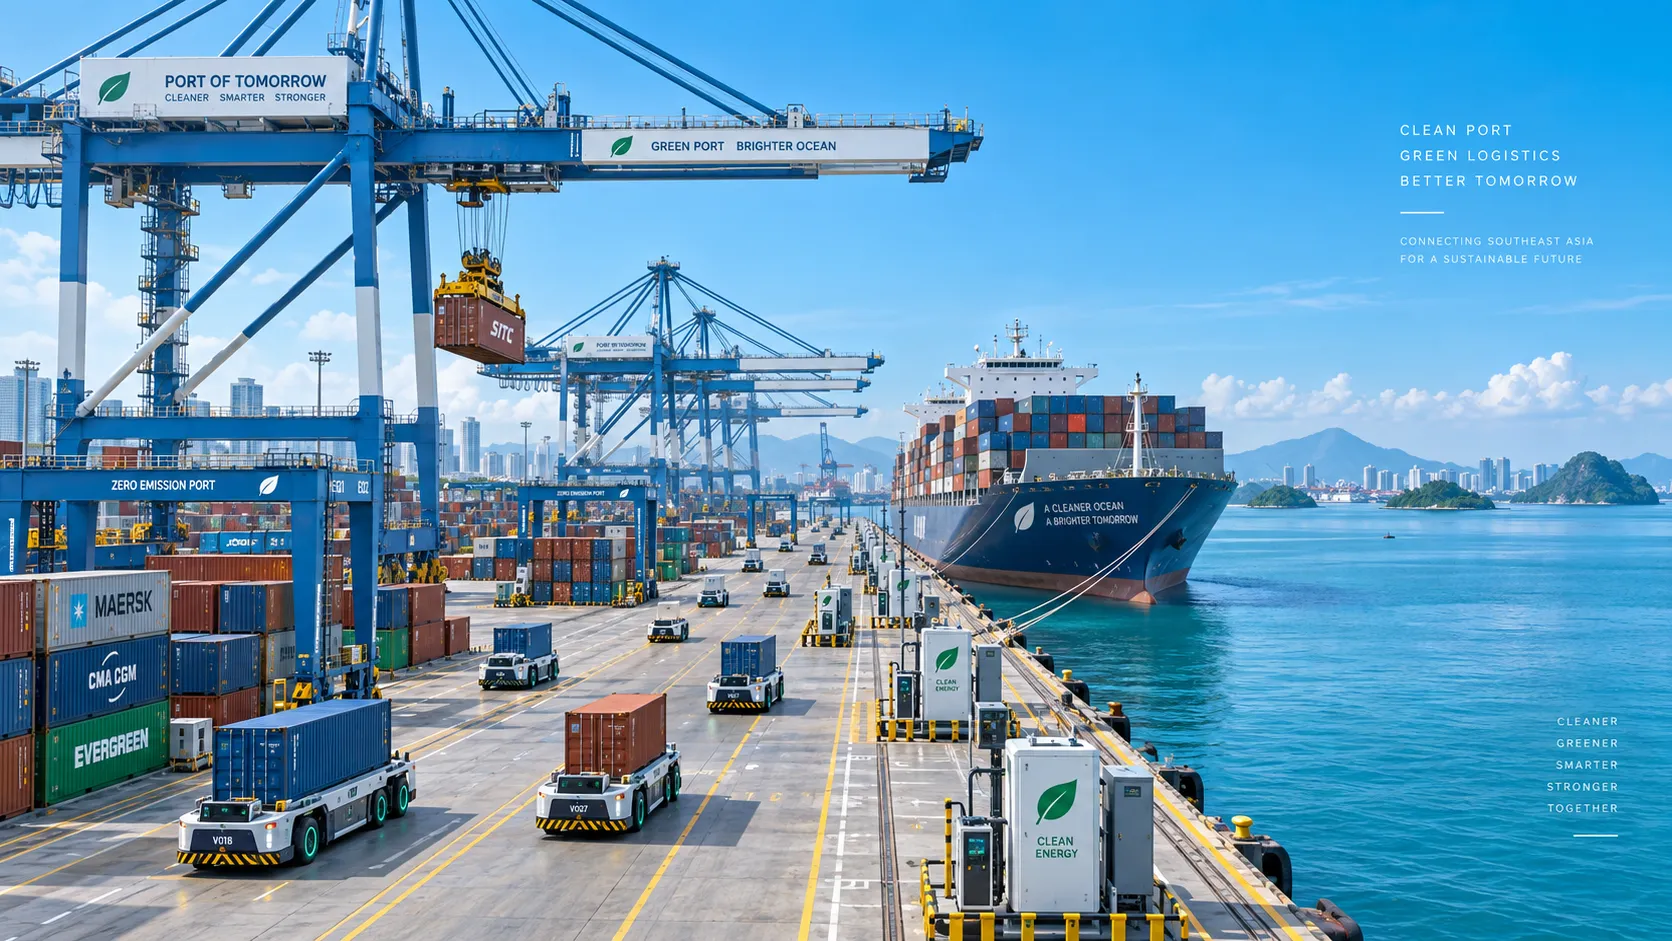
Smart Port Systems in Southeast Asia: Investment Priorities and Adoption Barriers
Smart port systems Southeast Asia: discover investment priorities, adoption barriers, and practical steps to build resilient, connected, high-performing terminals.

How to Evaluate Terminal Efficiency Solution Suppliers for High-Throughput Operations
Choose a terminal efficiency solutions supplier with confidence. Explore proven criteria for throughput, integration, lifecycle cost, safety, and reliable delivery.
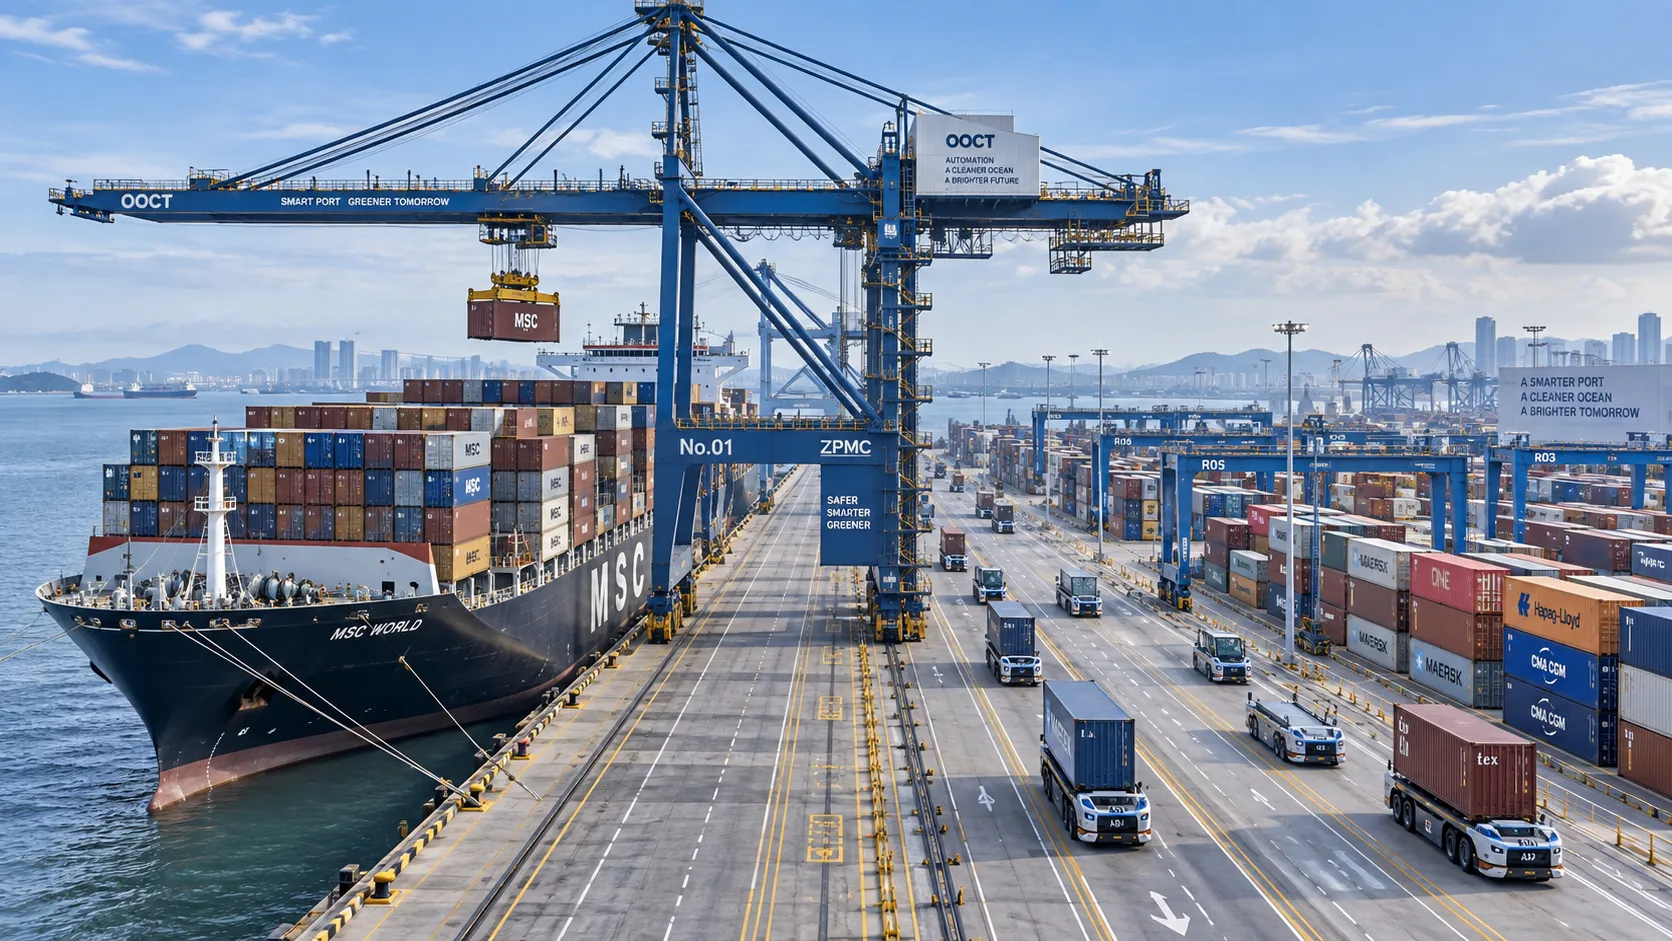
How to Specify a Quay Crane for Container Terminals by Vessel Size and Throughput?
Quay crane for container terminals: learn how to match outreach, lift height, capacity, automation, and cycle performance to vessel size and throughput goals.
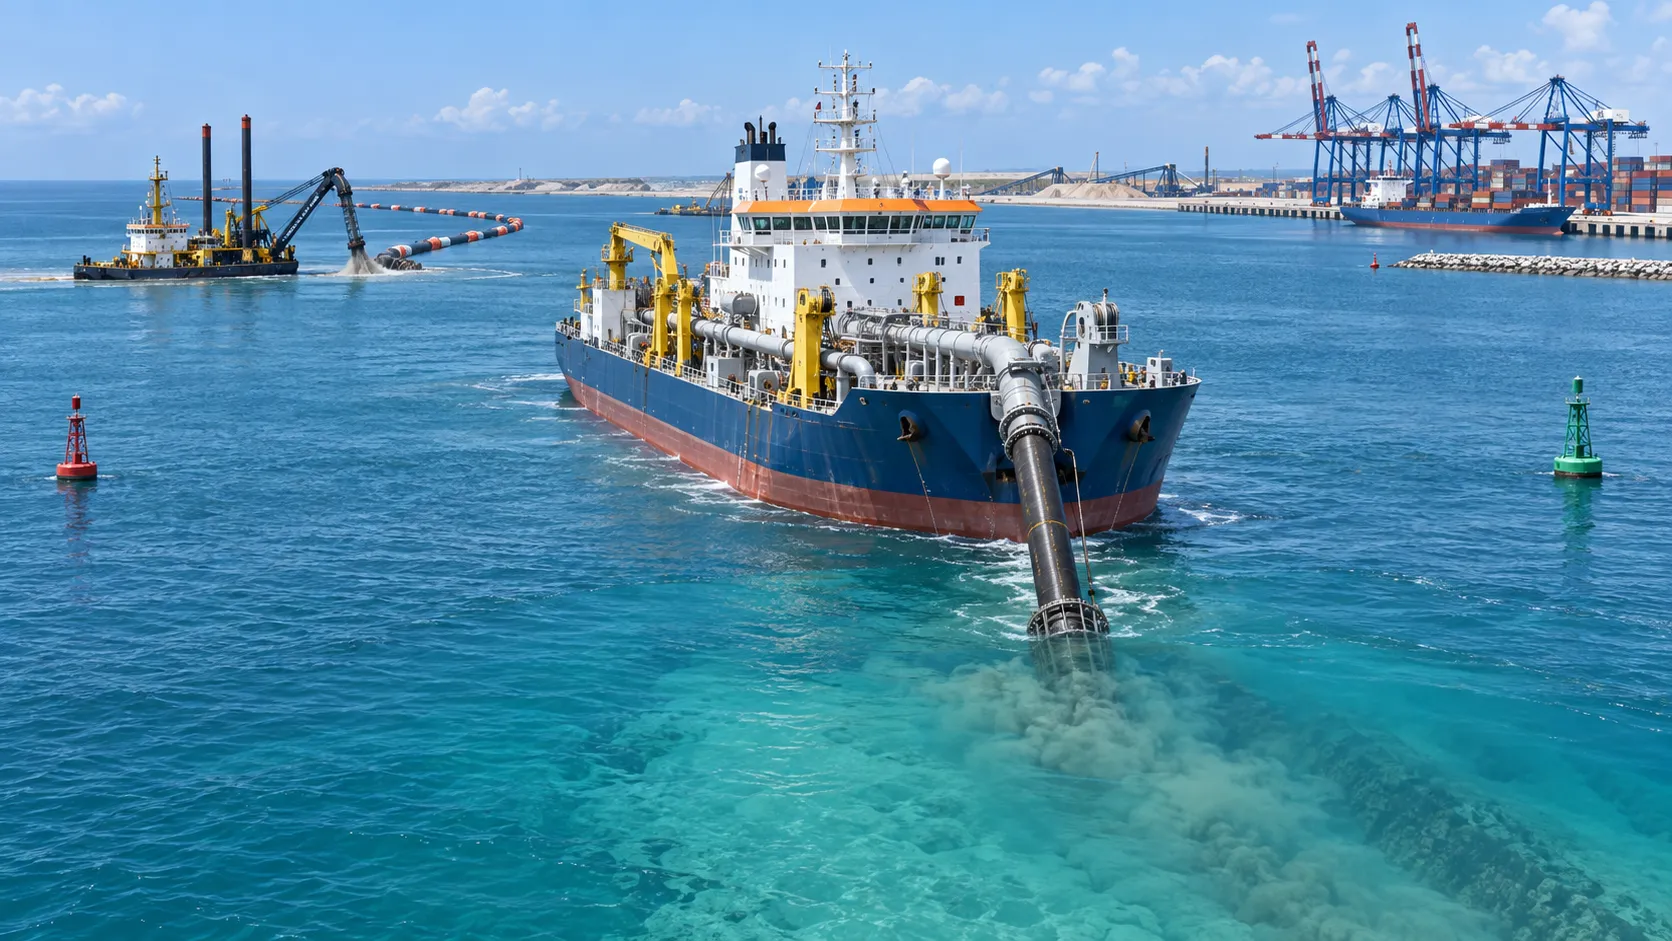
What Dredging Equipment Is Needed for Channel Deepening?
What dredging equipment is needed for channel deepening? Explore dredgers, pipelines, survey tools, and planning strategies for safer, more efficient port access.

Which Bulk Handling Equipment Suits High-Moisture Cargo?
Which bulk handling equipment suits high-moisture cargo? Compare belt, apron, screw, drag, and slurry systems for reliable flow, less carryback, and higher terminal uptime.
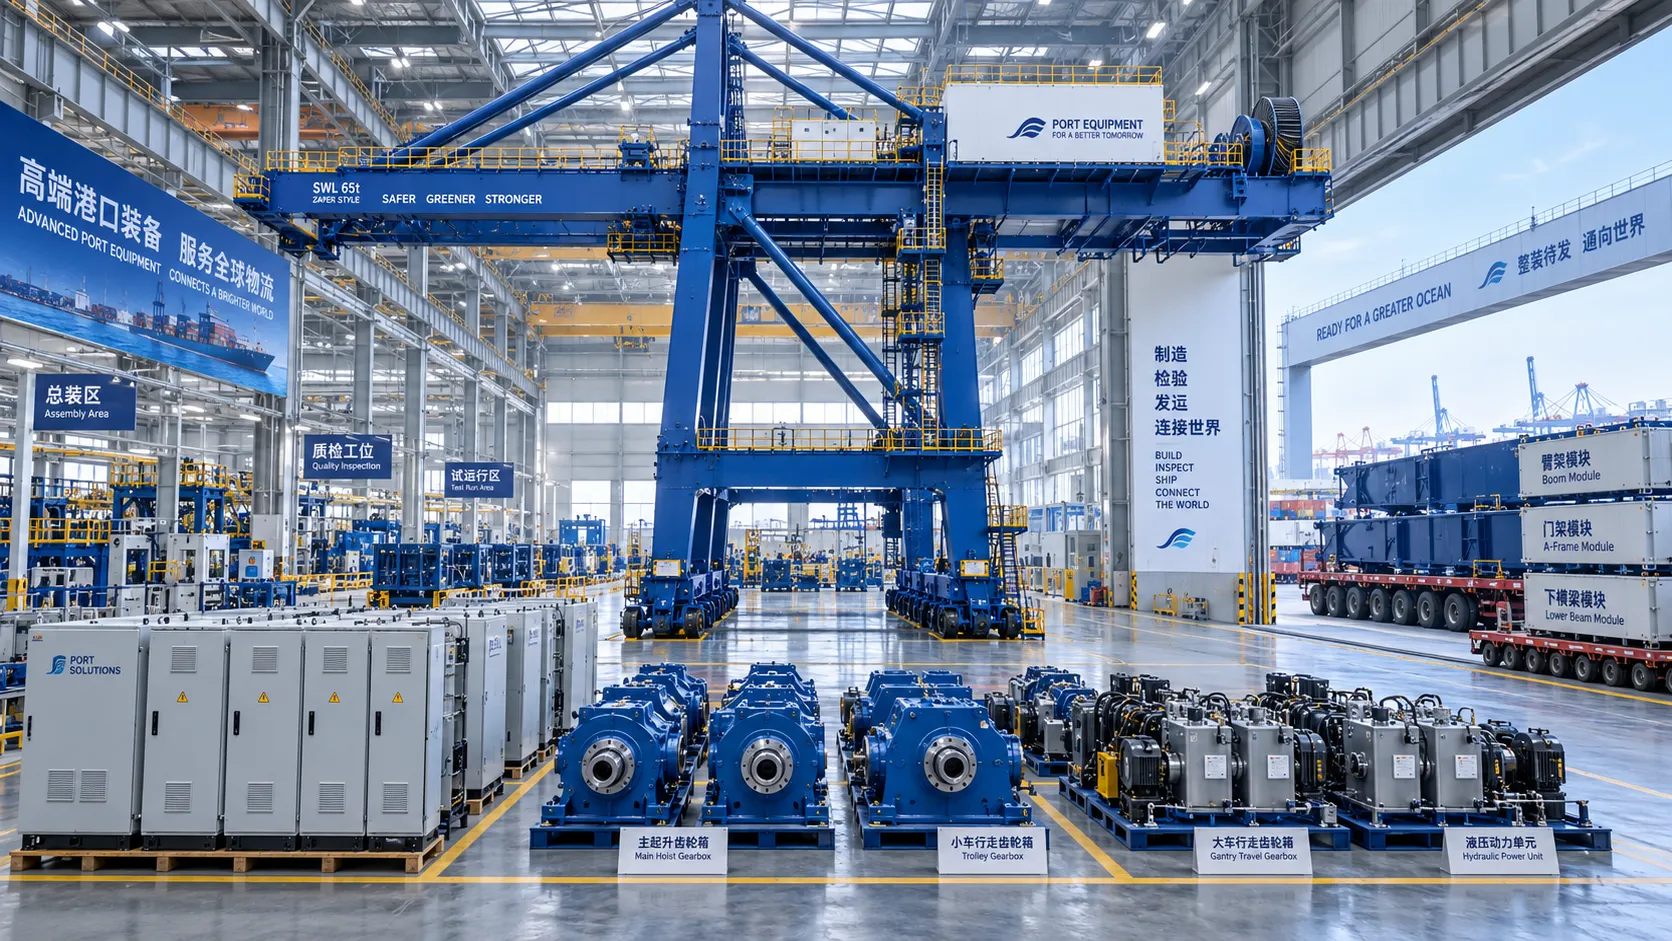
How Can Port Equipment Lead-Time Risk Be Managed?
How can port equipment lead-time risk be managed? Explore practical strategies to control critical paths, suppliers, transport, site readiness, and commissioning delays.
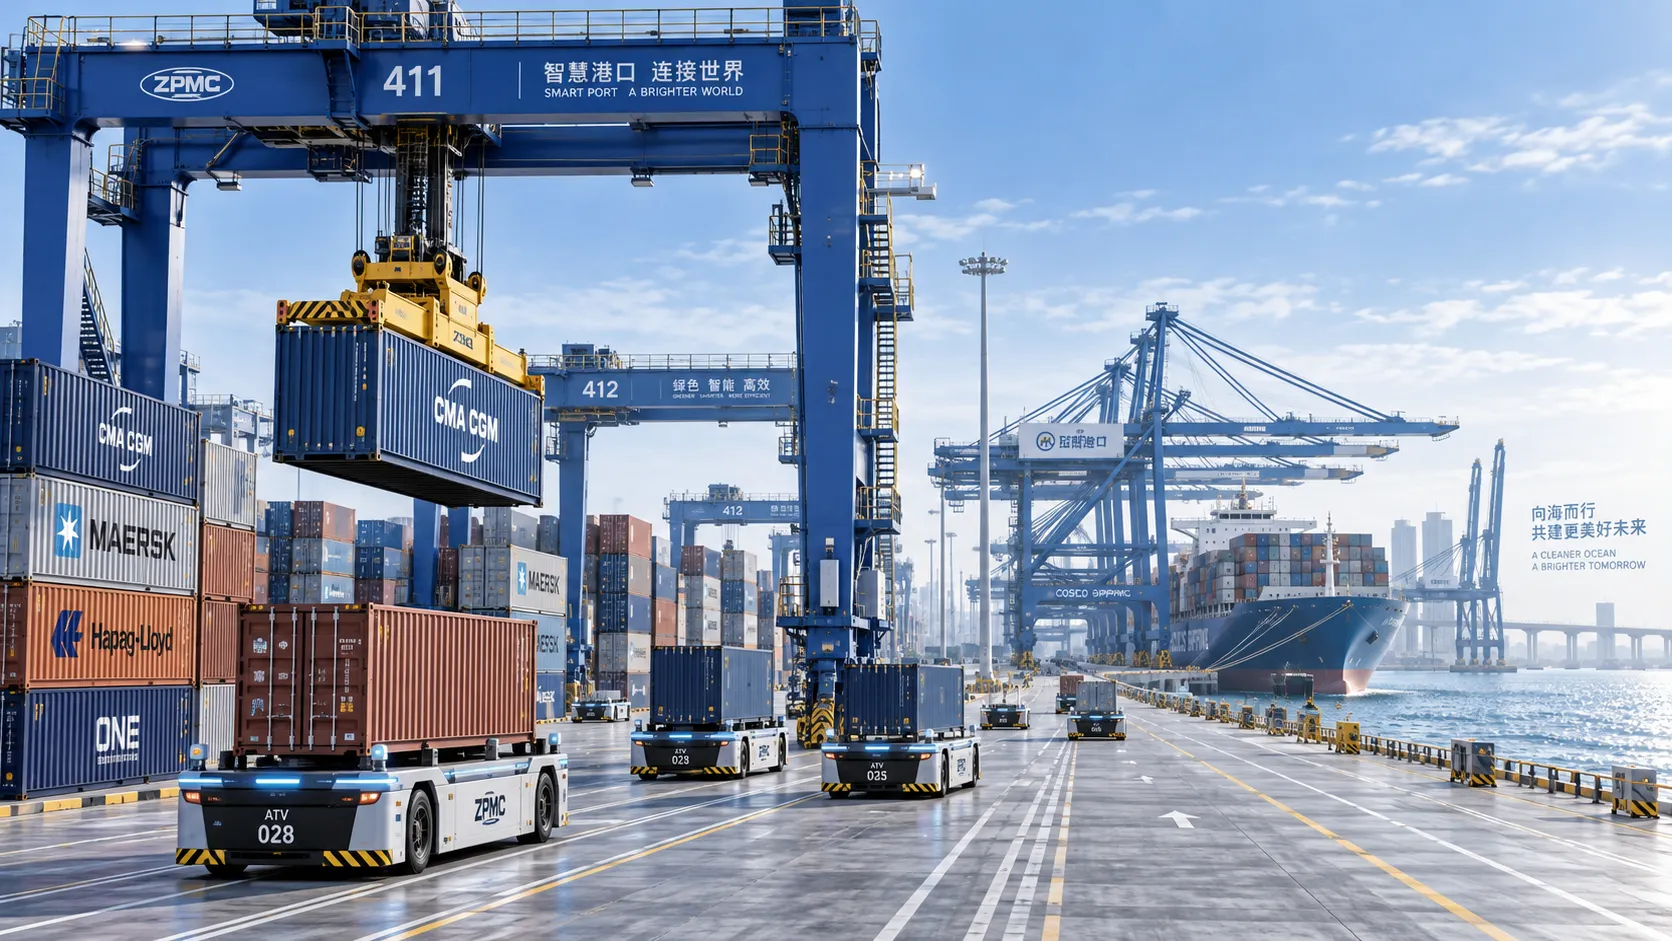
Terminal Automation Technologies That Raise Container Throughput Without Yard Disruption
Terminal automation technology that increases container throughput without disrupting yard flow. Explore smarter integration, resilient workflows, and phased deployment strategies.
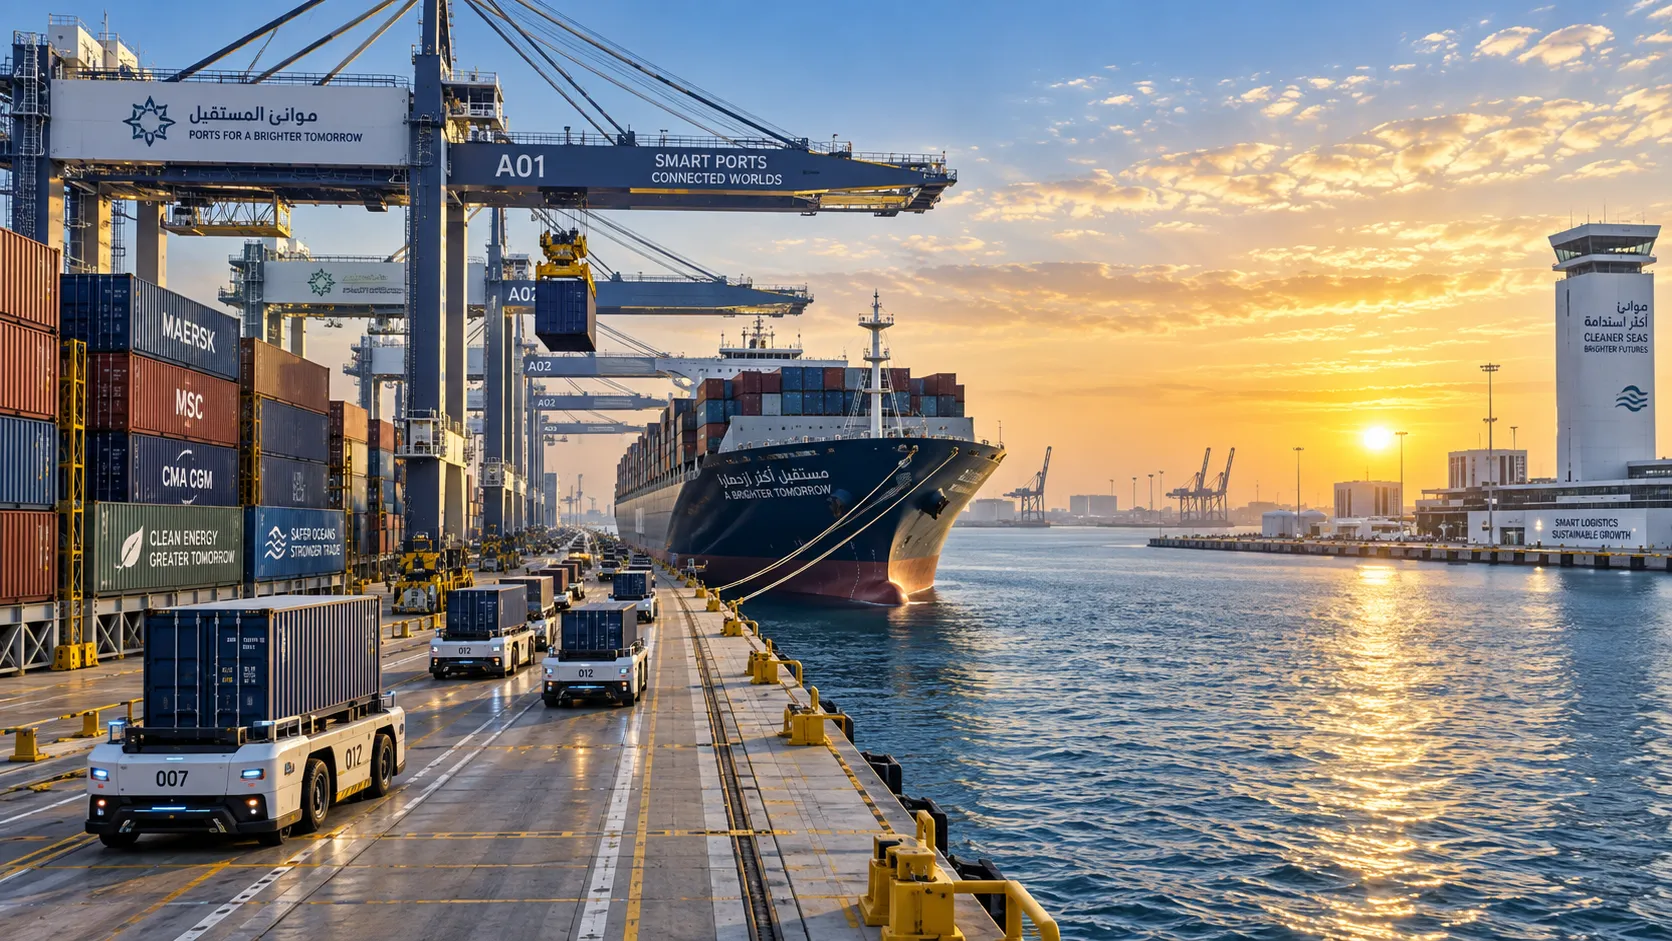
Middle East Port Automation: Key Market Drivers, Projects, and Investment Risks
Port automation systems Middle East: explore market drivers, flagship projects, integration challenges, and investment risks shaping smarter, resilient terminals.
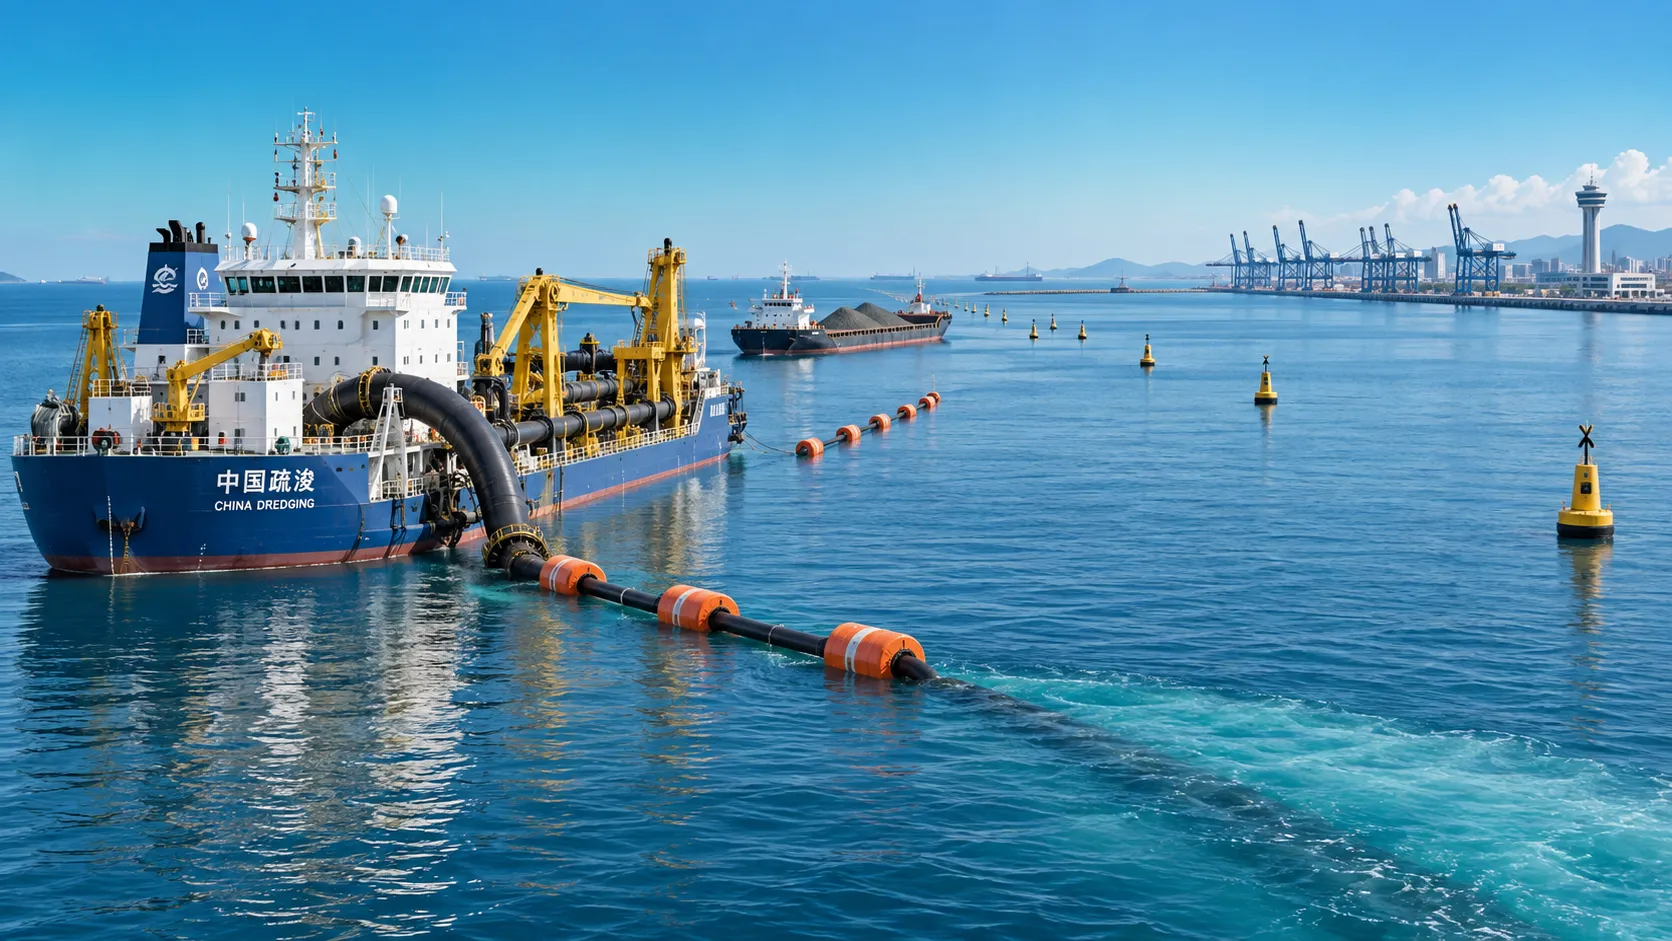
Planning Offshore Dredging Operations: Key Risks, Methods, and Project Controls
Offshore dredging operations demand smart planning. Explore key risks, proven methods, environmental controls, and project strategies for reliable delivery.