Related News
- 00
0000-00
How Can Port Equipment Lead-Time Risk Be Managed? - 00
0000-00
Maritime Logistics Operations: How Ports Can Reduce Container Dwell Time - 00
0000-00
What Does Logistics Node Monitoring Cost Across Warehouses and Transport Hubs? - 00
0000-00
How Can IoT Smart Port Solutions Improve Container Tracking and Yard Efficiency? - 00
0000-00
How Real-Time Port Logistics Intelligence Improves Container Yard Efficiency
Real Time Logistics Node Monitoring: Which Metrics Matter for Port Network Control?
Real Time Logistics Node Monitoring: Which Metrics Matter for Port Network Control?
For enterprise decision-makers managing complex port networks, real time logistics node monitoring is no longer optional. It is the basis of faster control, lower disruption risk, and stronger asset utilization.
But not every dashboard metric deserves attention. In port operations, too much visibility can still create weak control if the wrong indicators drive daily decisions.
The practical goal is simple. Use real time logistics node monitoring to detect congestion early, protect vessel schedules, and coordinate equipment, labor, and yard capacity across linked nodes.
For ports, a node is not only a berth. It includes quay cranes, transfer lanes, yard blocks, gates, AGV routes, feeder links, and even dredging-dependent access channels.
That also means effective real time logistics node monitoring must connect mechanical performance, traffic flow, control logic, and commercial service reliability in one operating view.
Why node monitoring changes port network control
Traditional reporting often explains yesterday. Network control needs signals that explain what is drifting right now and what will fail next if nobody intervenes.
This is where real time logistics node monitoring becomes valuable. It converts scattered events into operational triggers that support dispatching, sequencing, slot planning, and exception handling.
In practice, the strongest monitoring models answer four control questions:
- Where is queue pressure building?
- Which assets are underperforming against plan?
- Which handoff between nodes is breaking flow?
- How close is service recovery before customer impact appears?
Once those answers become visible, port control shifts from reactive escalation to active network balancing.
The core metrics that actually matter
The most useful real time logistics node monitoring metrics are not the longest list. They are the smallest set that reveals flow stability, bottleneck risk, and recovery capacity.
1. Node throughput versus planned throughput
This is the first control metric. It compares actual moves, tons, or transfers against the expected rate for each node and time window.
The gap matters more than the raw number. A small negative variance at one crane may be harmless, but the same variance across several linked nodes signals network slippage.
2. Queue length and queue age
Many operators track queue size. Fewer track how long units stay inside that queue. Queue age often exposes a more serious control problem.
A short but stagnant queue means a handoff failure. A long but fast-moving queue may still be acceptable during a planned peak.
3. Equipment availability and effective utilization
Availability alone is misleading. A crane can be technically available yet lose value because of idle waiting, control conflicts, or poor truck and yard synchronization.
Effective utilization measures how much scheduled capacity is turned into productive work. In real time logistics node monitoring, this metric directly links engineering status to operating output.
4. Dwell time by node type
Dwell time should be segmented. Yard dwell, gate dwell, berth dwell, and transfer dwell describe different failure patterns and need different responses.
When dwell time rises without matching volume growth, the system is usually losing coordination rather than handling extra demand.
5. Handoff latency between adjacent nodes
This is one of the most overlooked metrics in port control. Handoff latency measures the delay between one node completing work and the next node starting it.
Examples include crane-to-AGV release time, AGV-to-yard block acceptance time, or gate clearance to stack allocation time. These gaps often create hidden capacity loss.
6. Schedule adherence and recovery speed
Not every delay matters equally. What matters is whether the node can recover before vessel windows, truck appointments, or feeder commitments are missed.
That is why real time logistics node monitoring should track both delay accumulation and recovery slope. The second number tells control teams whether intervention is still optional.
Metrics that support strategic decisions
The core metrics manage immediate flow. Strategic metrics help leaders decide where to invest, automate, redesign, or renegotiate service models across the port network.
- Bottleneck recurrence rate by node and shift
- Energy use per productive move
- Exception frequency by control system or equipment family
- Yard density versus retrieval efficiency
- Weather or channel constraint impact on service continuity
These indicators help explain whether issues come from temporary imbalance or structural design limitations. That distinction is critical before expanding assets or changing operating logic.
For organizations managing automated terminals, specialized handling systems, or dredging-sensitive access routes, that wider view supports more accurate capital and risk decisions.
How to structure a useful monitoring model
A workable real time logistics node monitoring model should follow flow logic, not software module boundaries. That point matters more than most teams expect.
If metrics stay isolated inside TOS, automation control, maintenance, or gate systems, the control room sees events but misses operational cause and effect.
A practical model usually includes:
- A standard node map covering berth, transfer, yard, gate, inland, and channel-related control points.
- A common event timestamp model for start, finish, release, acceptance, waiting, and exception states.
- Thresholds based on operational risk, not generic software defaults.
- Escalation rules tied to dispatch, maintenance, replanning, or customer service actions.
- A short list of executive metrics that roll up local detail into network control decisions.
When built this way, real time logistics node monitoring becomes an operating discipline rather than a passive reporting layer.
Common mistakes that weaken monitoring value
Several patterns reduce the business value of monitoring, even when ports invest heavily in automation and data collection.
- Tracking asset uptime without measuring productive flow.
- Using average values that hide short but damaging congestion spikes.
- Watching each terminal separately while ignoring cross-terminal spillover effects.
- Treating alarms as information instead of linking them to decision rights.
- Adding too many indicators and diluting control focus.
A better approach is selective depth. Start with the metrics that reveal delay propagation and asset coordination loss, then expand only where decisions improve.
That is especially important in large maritime networks, where speed of interpretation often matters more than volume of data.
What decision-makers should do next
The next step is not to request another broad dashboard. It is to identify the control points where delay spreads fastest across the network.
From there, define a real time logistics node monitoring set that combines throughput variance, queue age, handoff latency, effective utilization, dwell time, and recovery speed.
Then connect each metric to an operational response. If a number does not change a dispatch, maintenance, planning, or customer action, it should not lead the control view.
For ports facing automation growth, tighter sustainability targets, and volatile shipping patterns, this discipline creates a direct advantage. It improves resilience without waiting for major infrastructure expansion.
In the end, real time logistics node monitoring matters because port control is really flow control. The winning metrics are the ones that show where flow slows, why it slows, and how fast it can be restored.
Related News
Smart Port Systems in Southeast Asia: Investment Priorities and Adoption Barriers
Smart port systems Southeast Asia: discover investment priorities, adoption barriers, and practical steps to build resilient, connected, high-performing terminals.
How to Evaluate Terminal Efficiency Solution Suppliers for High-Throughput Operations
Choose a terminal efficiency solutions supplier with confidence. Explore proven criteria for throughput, integration, lifecycle cost, safety, and reliable delivery.
How to Specify a Quay Crane for Container Terminals by Vessel Size and Throughput?
Quay crane for container terminals: learn how to match outreach, lift height, capacity, automation, and cycle performance to vessel size and throughput goals.
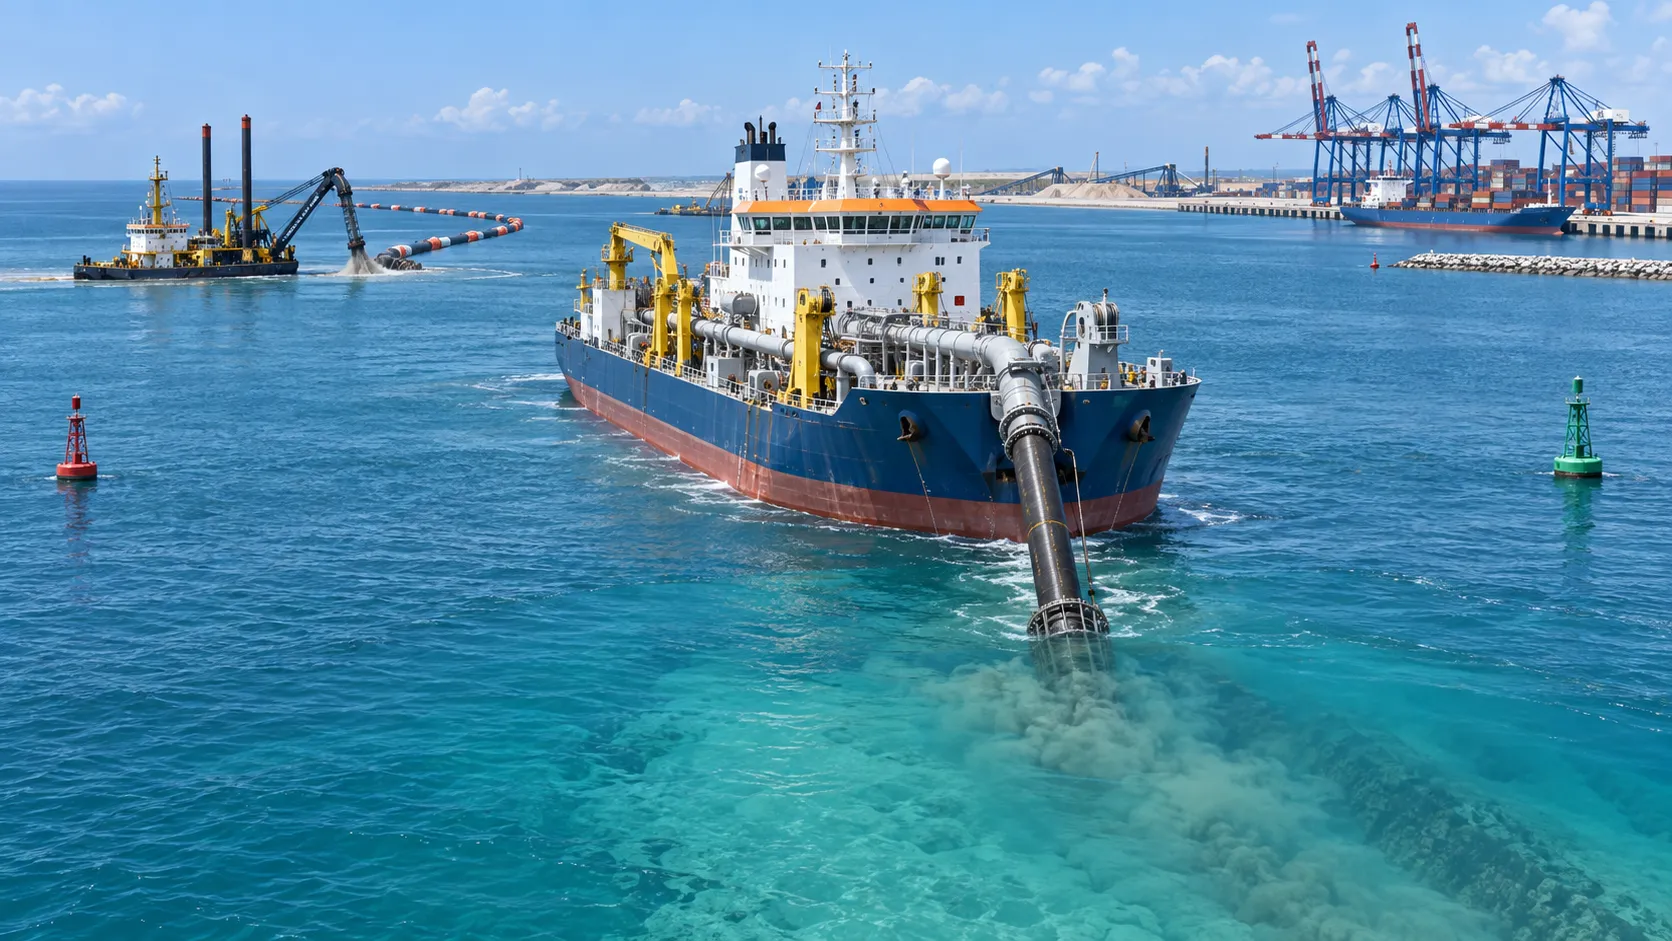
What Dredging Equipment Is Needed for Channel Deepening?
What dredging equipment is needed for channel deepening? Explore dredgers, pipelines, survey tools, and planning strategies for safer, more efficient port access.
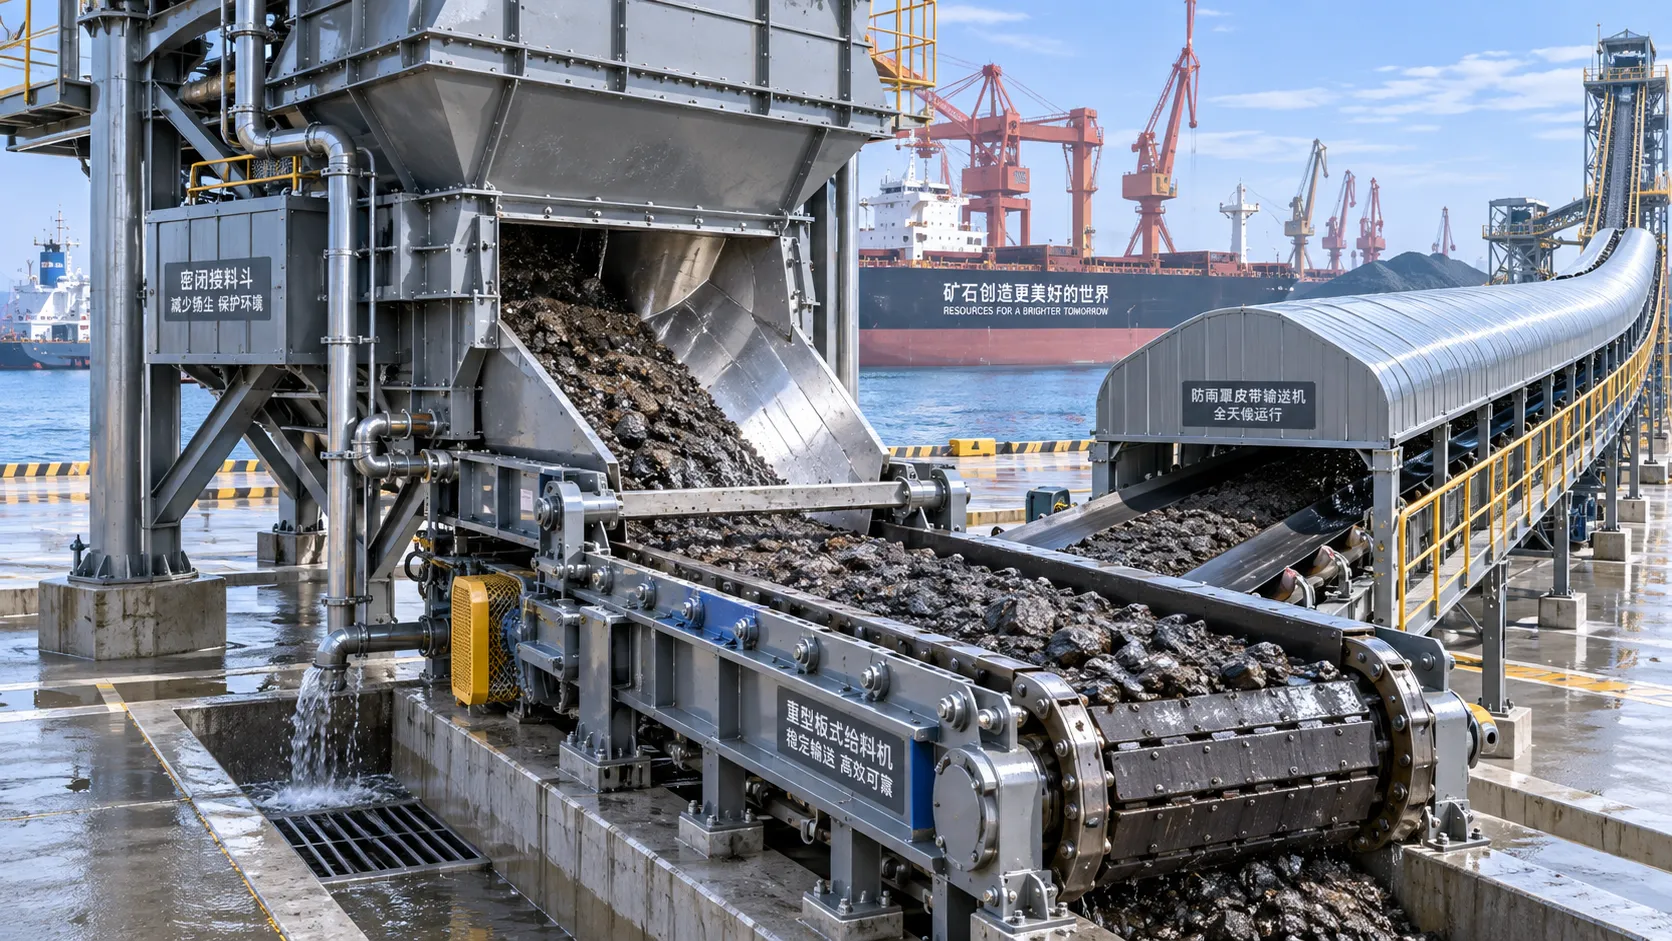
Which Bulk Handling Equipment Suits High-Moisture Cargo?
Which bulk handling equipment suits high-moisture cargo? Compare belt, apron, screw, drag, and slurry systems for reliable flow, less carryback, and higher terminal uptime.
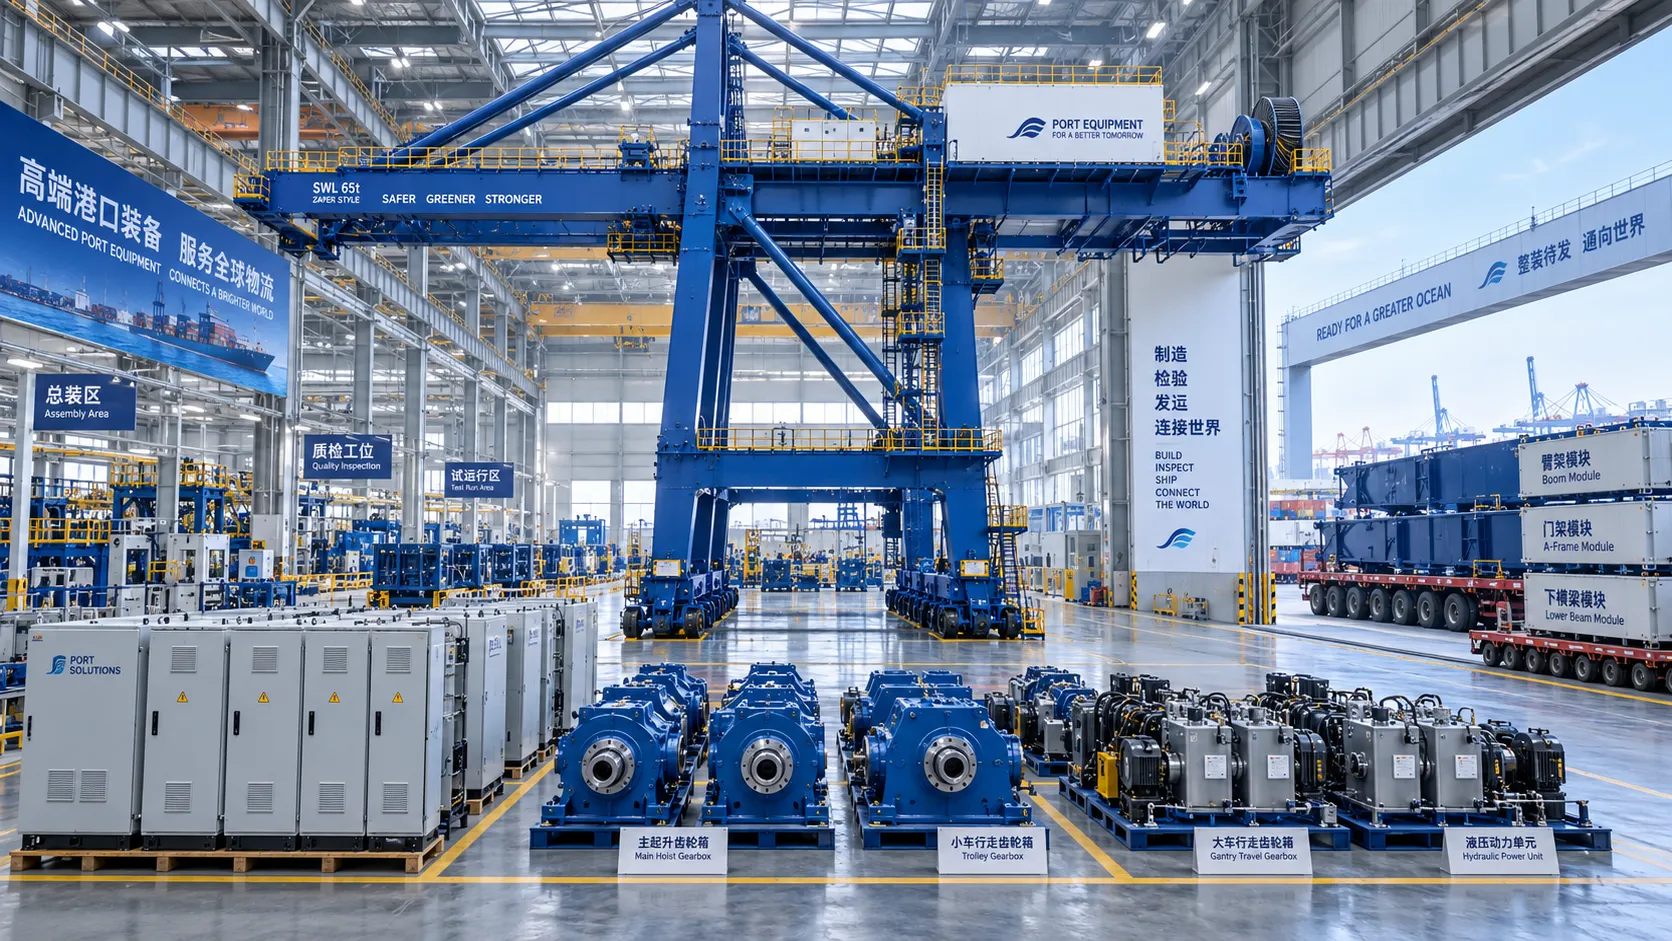
How Can Port Equipment Lead-Time Risk Be Managed?
How can port equipment lead-time risk be managed? Explore practical strategies to control critical paths, suppliers, transport, site readiness, and commissioning delays.
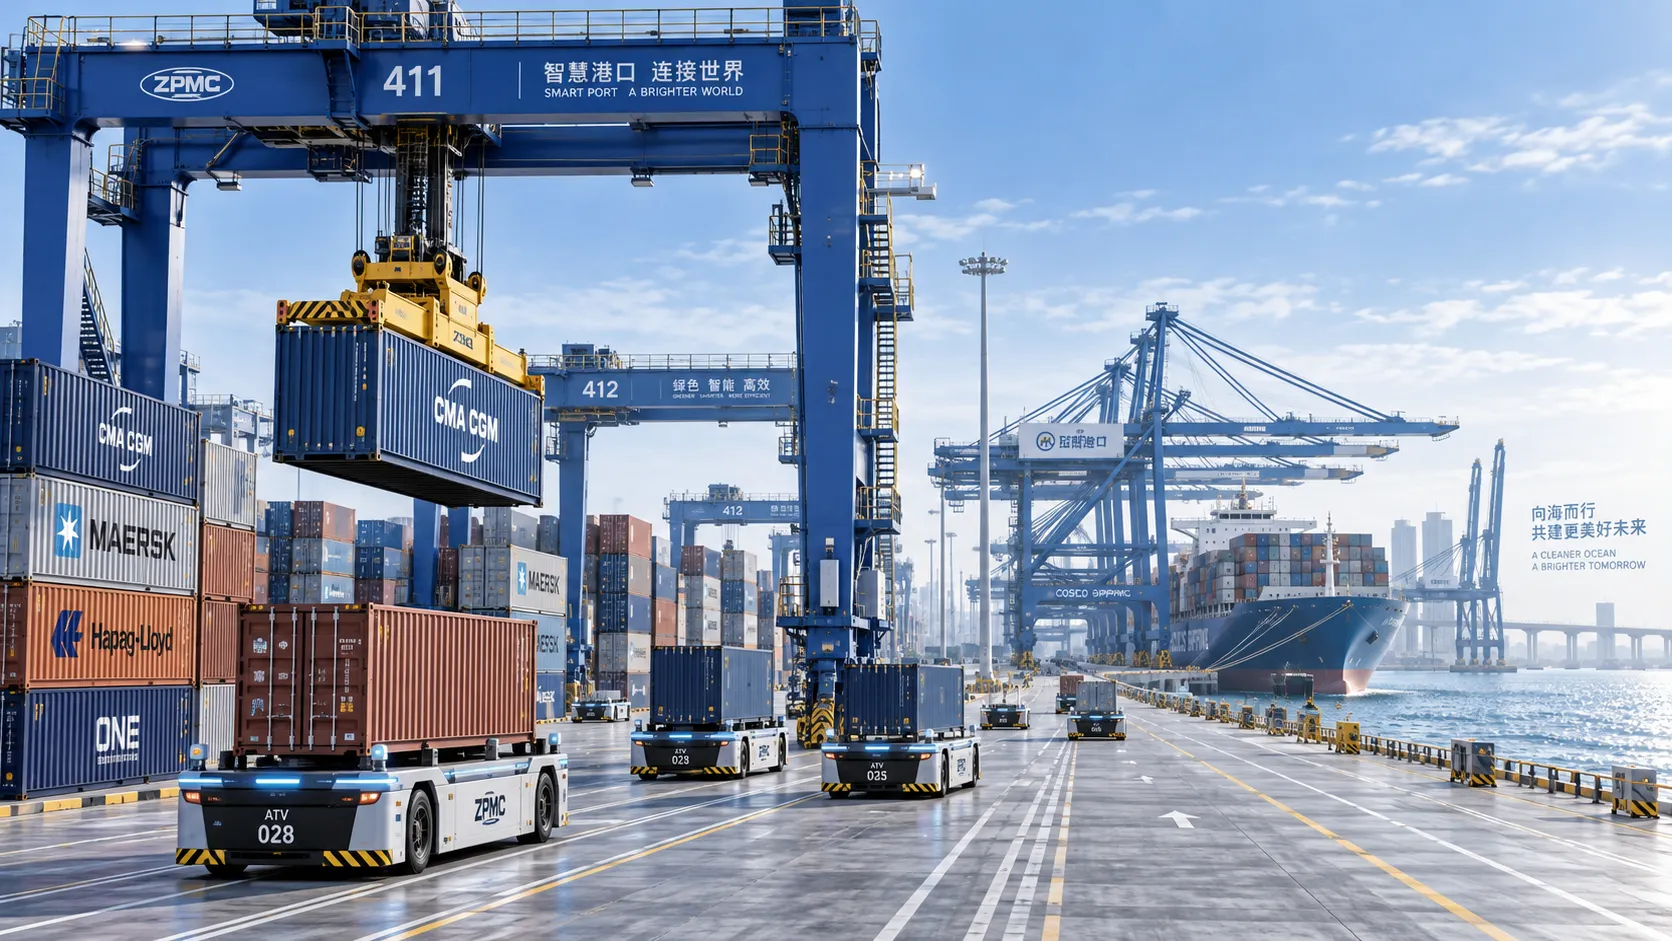
Terminal Automation Technologies That Raise Container Throughput Without Yard Disruption
Terminal automation technology that increases container throughput without disrupting yard flow. Explore smarter integration, resilient workflows, and phased deployment strategies.
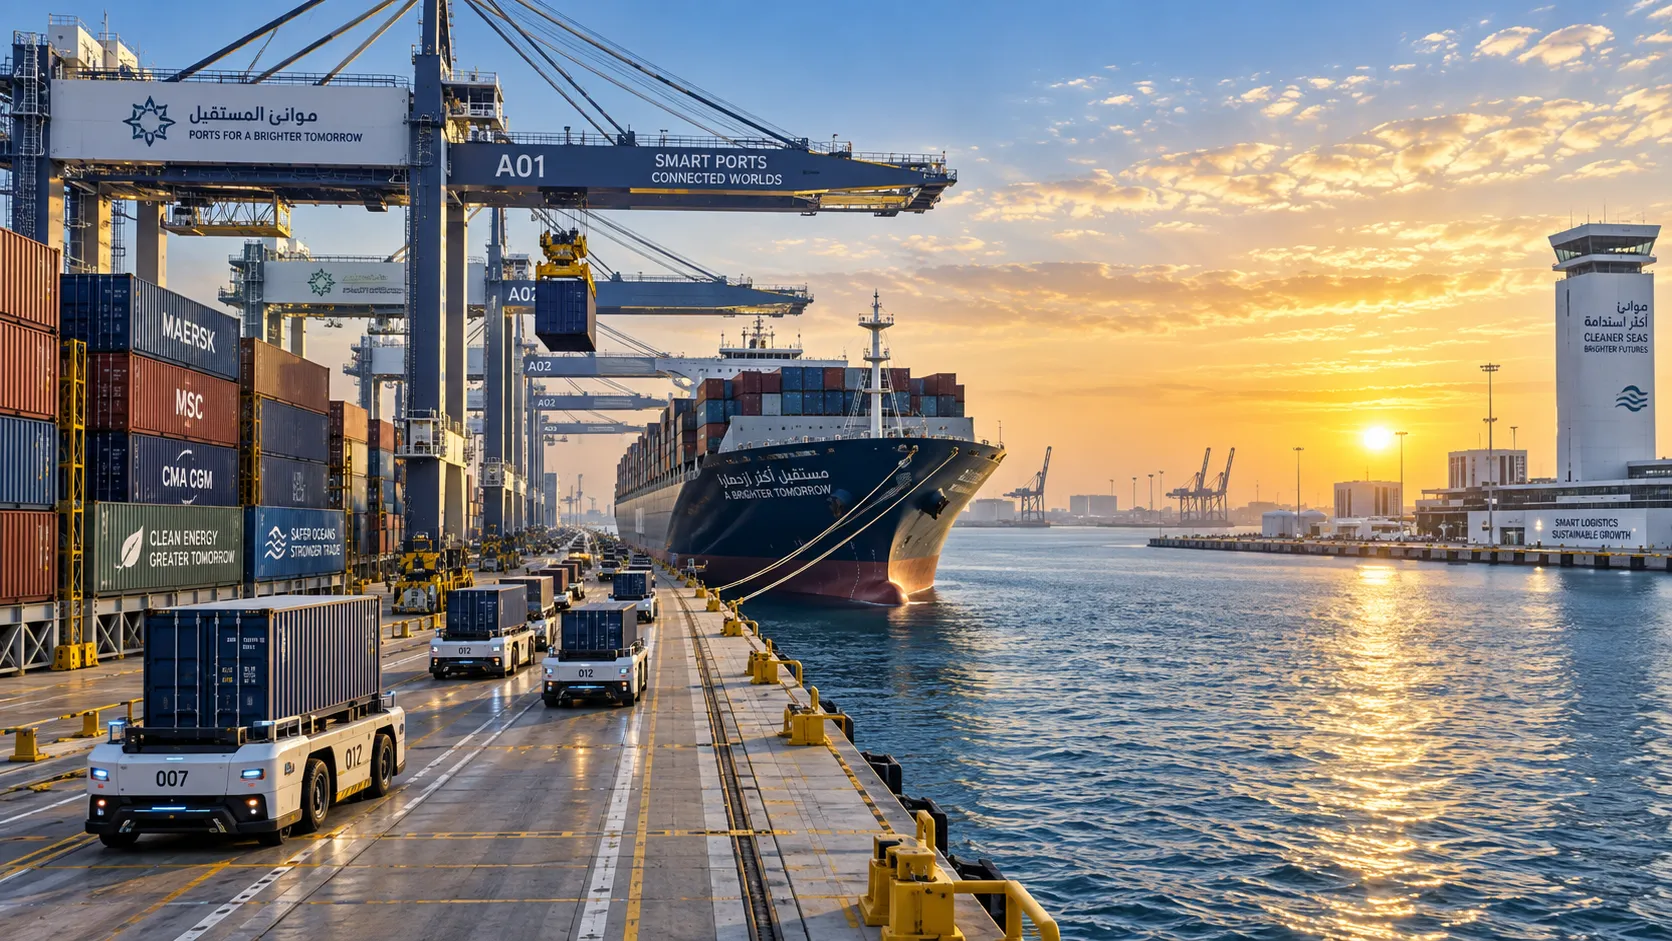
Middle East Port Automation: Key Market Drivers, Projects, and Investment Risks
Port automation systems Middle East: explore market drivers, flagship projects, integration challenges, and investment risks shaping smarter, resilient terminals.
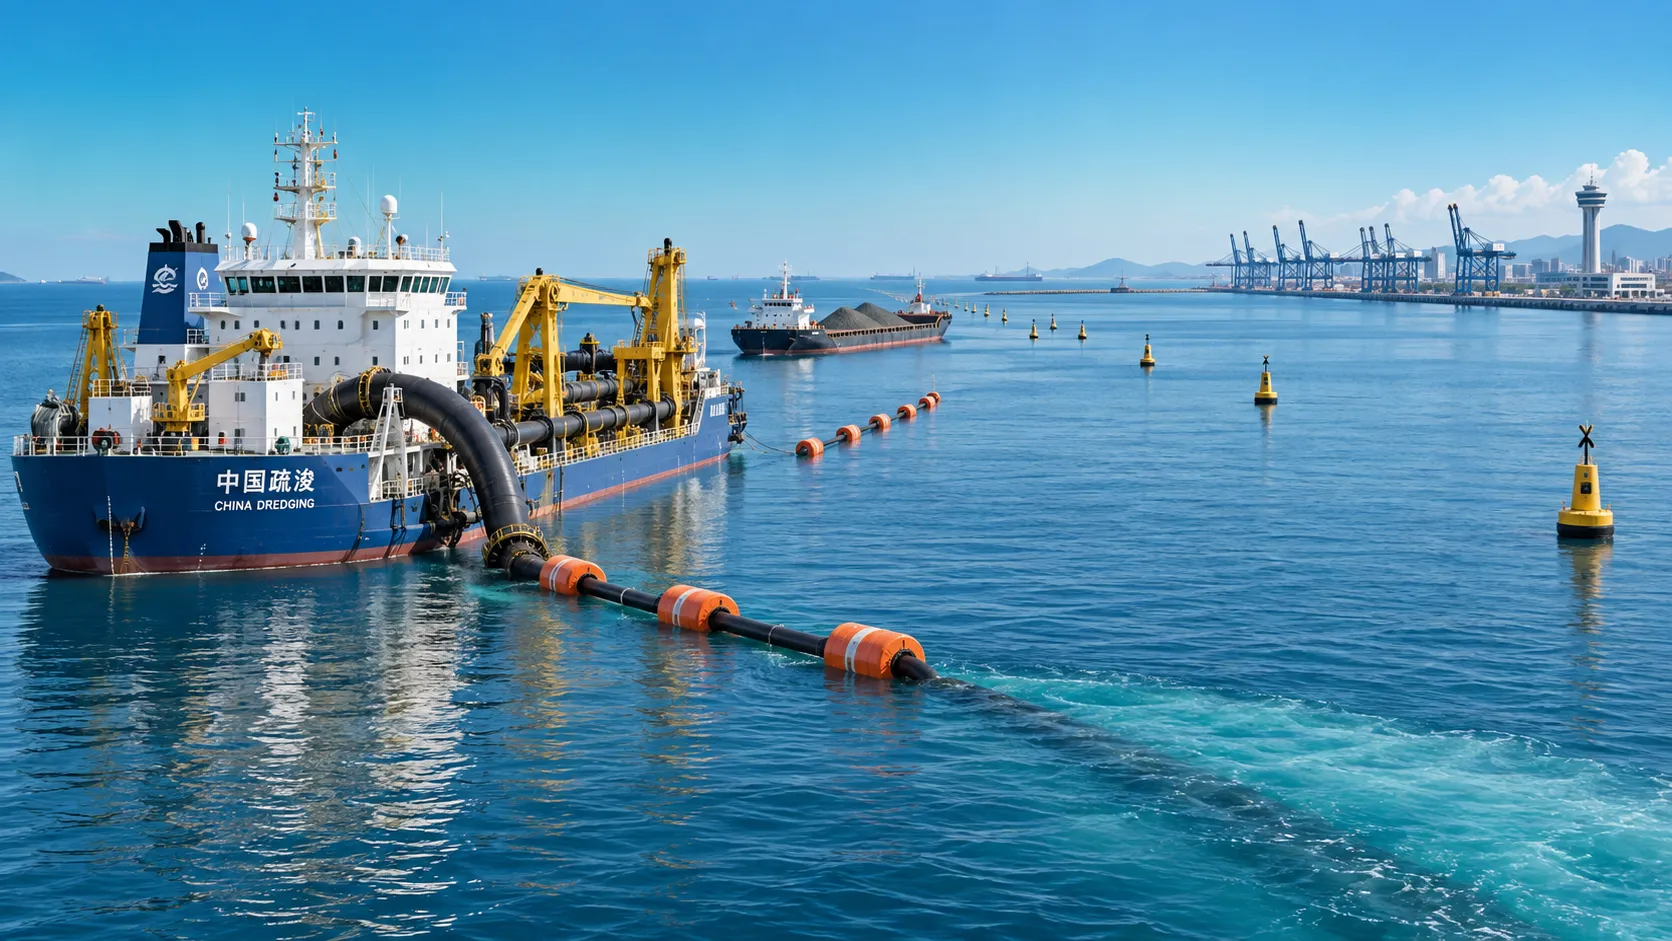
Planning Offshore Dredging Operations: Key Risks, Methods, and Project Controls
Offshore dredging operations demand smart planning. Explore key risks, proven methods, environmental controls, and project strategies for reliable delivery.