Related News
- 00
0000-00
How Can Port Equipment Lead-Time Risk Be Managed? - 00
0000-00
Maritime Logistics Operations: How Ports Can Reduce Container Dwell Time - 00
0000-00
What Does Logistics Node Monitoring Cost Across Warehouses and Transport Hubs? - 00
0000-00
How Can IoT Smart Port Solutions Improve Container Tracking and Yard Efficiency? - 00
0000-00
How Real-Time Port Logistics Intelligence Improves Container Yard Efficiency
How Global Supply Chains Affect Lead Times, Freight Costs, and Sourcing Risk
In a trade cycle shaped by disruption, global supply chains no longer influence only transport. They shape delivery promises, landed cost accuracy, and the confidence behind sourcing decisions.
A supplier may quote a competitive price, yet port delays, vessel shortages, terminal inefficiencies, or inland bottlenecks can erase that advantage within weeks.
That is why lead times, freight costs, and sourcing risk must be read together. In practice, they are three visible outcomes of the same global logistics system.
Across maritime trade, the most useful signals often sit below the surface: crane productivity, yard density, dredging capacity, automation maturity, and route resilience.
Seen through that lens, global supply chains become easier to evaluate. They are not abstract networks, but operating environments with measurable constraints and opportunities.
Why supply chain conditions now move faster than planning cycles
For years, many cross-border models assumed relative stability. That assumption is weaker today, because volatility now comes from several layers at once.
Freight markets react to fuel prices, alliance capacity shifts, canal restrictions, labor actions, weather events, and geopolitical rerouting. Each factor changes timing and cost differently.
Port infrastructure also matters more than before. A modern terminal with automated container handling can recover faster from surges than a congested manual yard.
This is where maritime intelligence becomes commercially useful. Platforms such as PS-Nexus track not only shipping rates, but also node-level conditions across ports and equipment systems.
That broader view helps explain why two suppliers in similar regions can produce very different delivery outcomes under the same market demand.
Lead times are built by many small delays
Lead time is often treated as a supplier promise. In reality, it is a chain of linked intervals from production release to final handoff.
The ocean segment gets most attention, but upstream and terminal-side timing can be just as important. Equipment availability, berth windows, customs processing, and drayage access all matter.
A port with high quay crane efficiency may shorten vessel turnaround. Yet if yard transfer systems are overloaded, containers still miss planned exit windows.
Similarly, dredging engineering affects reliability in a less visible way. Fairway depth constraints can limit vessel calls, alter load factors, or redirect traffic to secondary hubs.
In global supply chains, lead time inflation usually comes from accumulation. A one-day delay at origin, another at transshipment, and one more inland can become a lost sales week.
Where lead time risk often starts
- Inconsistent booking acceptance during tight vessel capacity periods
- Low terminal throughput caused by aging port gear or poor scheduling logic
- Transshipment dependency on already congested regional hubs
- Seasonal draft, weather, or dredging constraints affecting vessel movement
- Weak inland connections from port gate to warehouse or production site
Freight cost is no longer just a rate card issue
Freight costs are often compared through base ocean rates, but actual spend is shaped by far more than the headline number.
Congestion surcharges, equipment imbalance fees, detention, demurrage, insurance adjustments, and rerouting premiums can materially change the landed cost profile.
Longer routes also create hidden cost layers. More transit days increase inventory carrying cost, reduce response speed, and raise exposure to demand forecast error.
This is why a low-cost sourcing region is not always low-cost in operational terms. Global supply chains reward total network efficiency, not isolated price advantages.
Port automation can soften some cost pressure. Better yard orchestration, remote-controlled cranes, and AGV path planning improve throughput and reduce avoidable dwell time.
When PS-Nexus follows these technical signals, the value is not academic. It helps explain whether freight inflation is temporary, structural, or linked to specific logistics nodes.
A practical way to read freight cost pressure
Sourcing risk is broader than supplier capability
A capable supplier can still sit inside a fragile logistics corridor. That distinction matters when assessing sourcing risk across global supply chains.
Risk sits at several levels: country policy, port access, terminal technology, carrier network exposure, and critical infrastructure resilience.
For example, dependence on one transshipment hub may look efficient on paper. It becomes risky when regional disruption affects berth access or feeder reliability.
Bulk and project cargo face another layer. Specialized handling machinery and dredging support can determine whether oversized or heavy shipments move on schedule.
This matters beyond marine sectors. Energy, industrial equipment, raw materials, and large-scale infrastructure programs all rely on dependable port-side execution.
Signals worth checking before locking a source
- How many port gateways support the supplier’s export flow
- Whether terminal automation reduces or increases operational bottlenecks
- How exposed the route is to chokepoints, sanctions, or conflict spillover
- Whether specialized cargo needs unique handling capacity at origin or destination
- How quickly alternative carriers or ports can be activated
Why maritime infrastructure deserves closer attention
Many sourcing reviews still focus on factory cost, contract terms, and transit estimates. That approach misses the infrastructure layer that often determines actual reliability.
Mega port terminal gear defines throughput ceilings. Specialized container handling affects yard fluidity. Automation systems coordinate cranes, vehicles, and storage logic in real time.
Dredging engineering is equally strategic. Expanding or maintaining navigable depth supports larger vessel calls, steadier schedules, and better long-term port competitiveness.
PS-Nexus is relevant here because it connects technical infrastructure signals with trade outcomes. That kind of intelligence helps bridge engineering conditions and commercial decision quality.
For businesses comparing sourcing regions, this perspective can reveal whether a route is merely available or genuinely scalable.
How to apply this in business evaluation
A useful assessment starts by replacing single-point assumptions with scenario thinking. One quoted transit time is rarely enough for reliable planning.
Compare best-case, expected, and stressed logistics outcomes. Then connect each one to revenue impact, inventory exposure, and supplier continuity.
It also helps to separate structural risk from temporary noise. A storm delay is different from a chronically under-capacity port or a politically unstable route.
Global supply chains should therefore be reviewed through a network scorecard, not just a vendor scorecard.
A more useful next step
The strongest decisions usually come from combining commercial data with logistics intelligence. Price, transit, and supply security should be reviewed as one system.
That means tracking not only suppliers, but also terminals, route design, port equipment performance, and regional infrastructure constraints.
For ongoing evaluation, global supply chains are best understood through changing nodes rather than static maps. Conditions shift, and decision criteria should shift with them.
A practical next move is to build a short review framework: map critical routes, identify vulnerable port dependencies, compare total landed cost scenarios, and monitor operational signals over time.
That approach creates a clearer basis for judging where speed, cost, and sourcing risk are acceptable, and where deeper investigation is still needed.
Related News
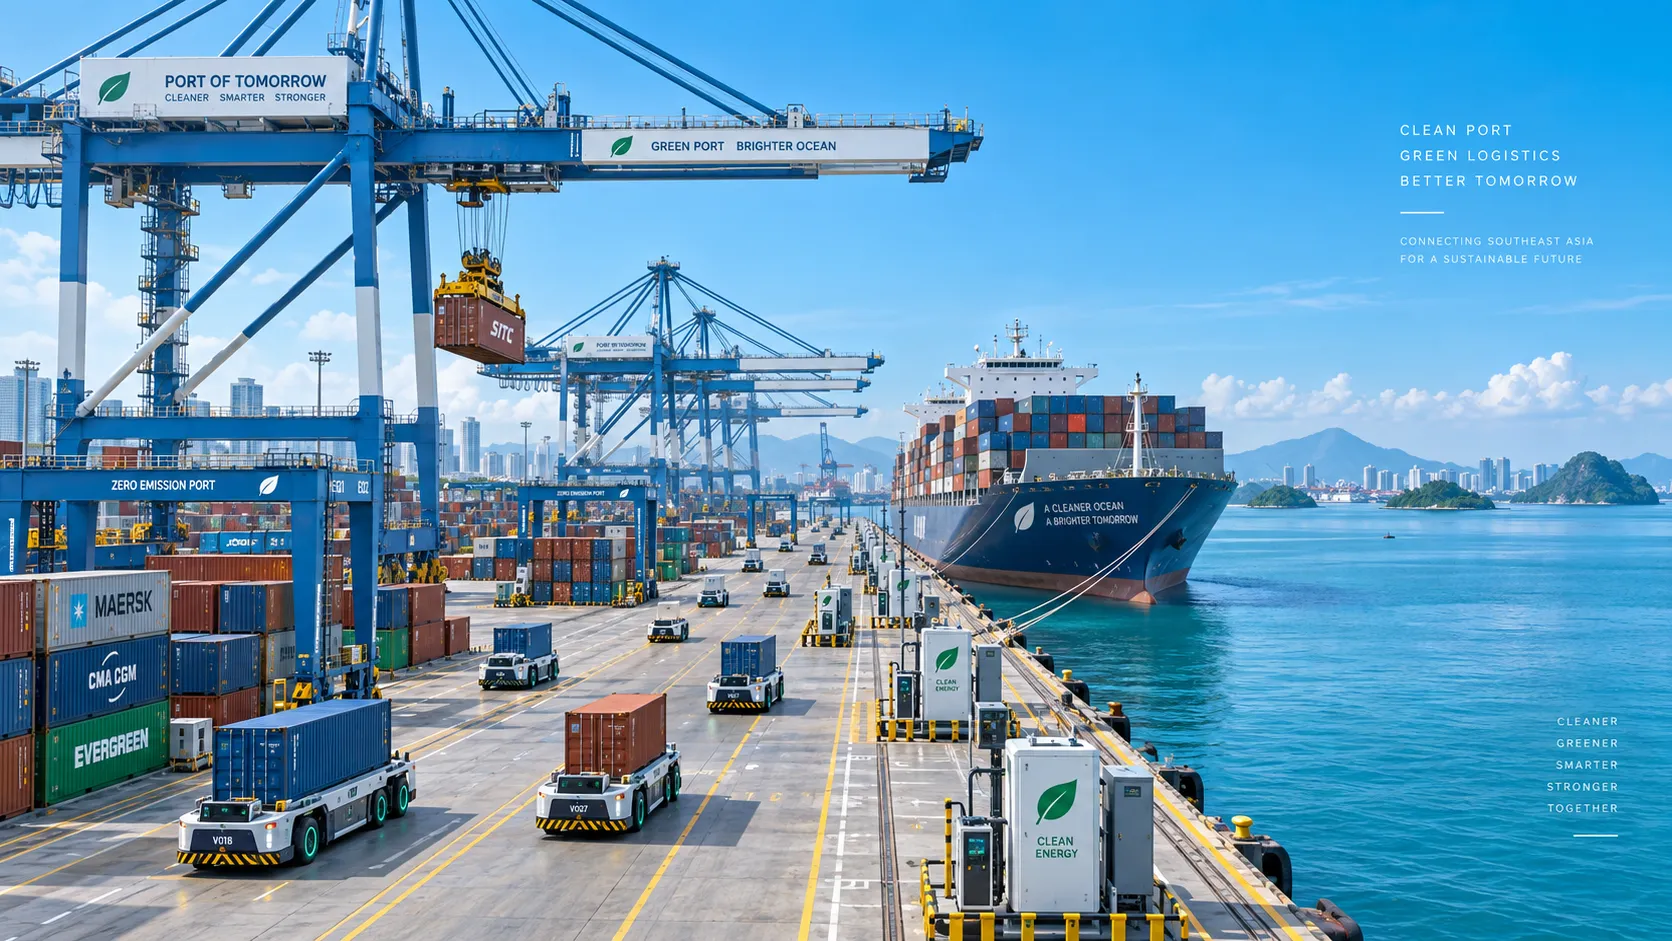
Smart Port Systems in Southeast Asia: Investment Priorities and Adoption Barriers
Smart port systems Southeast Asia: discover investment priorities, adoption barriers, and practical steps to build resilient, connected, high-performing terminals.
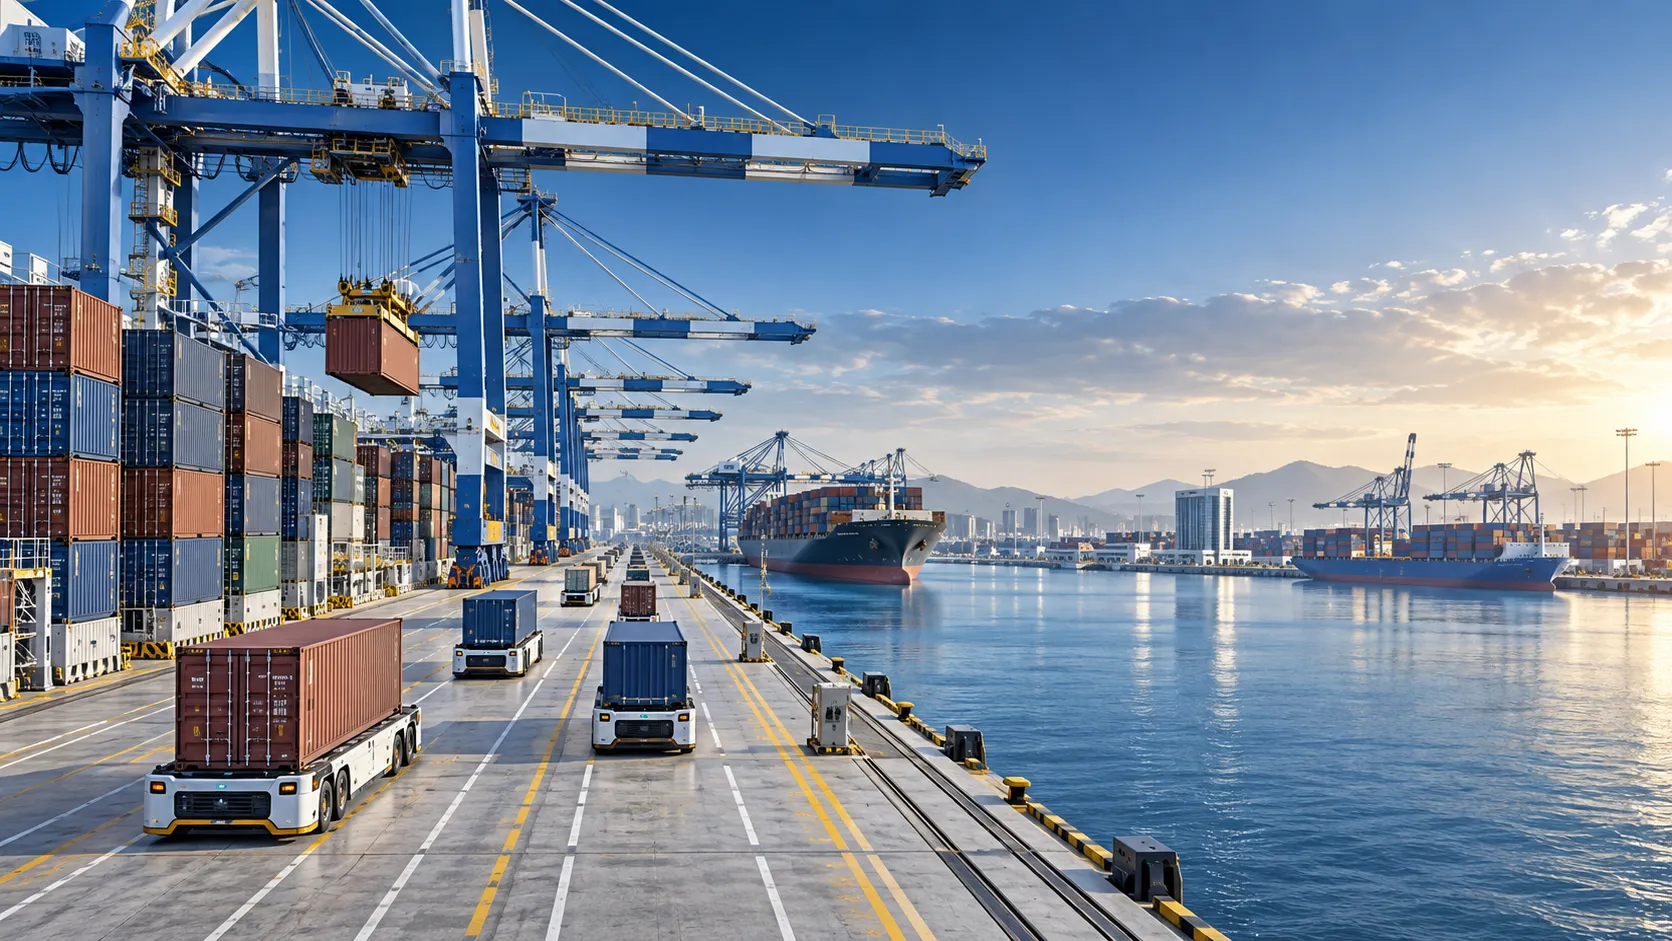
How to Evaluate Terminal Efficiency Solution Suppliers for High-Throughput Operations
Choose a terminal efficiency solutions supplier with confidence. Explore proven criteria for throughput, integration, lifecycle cost, safety, and reliable delivery.
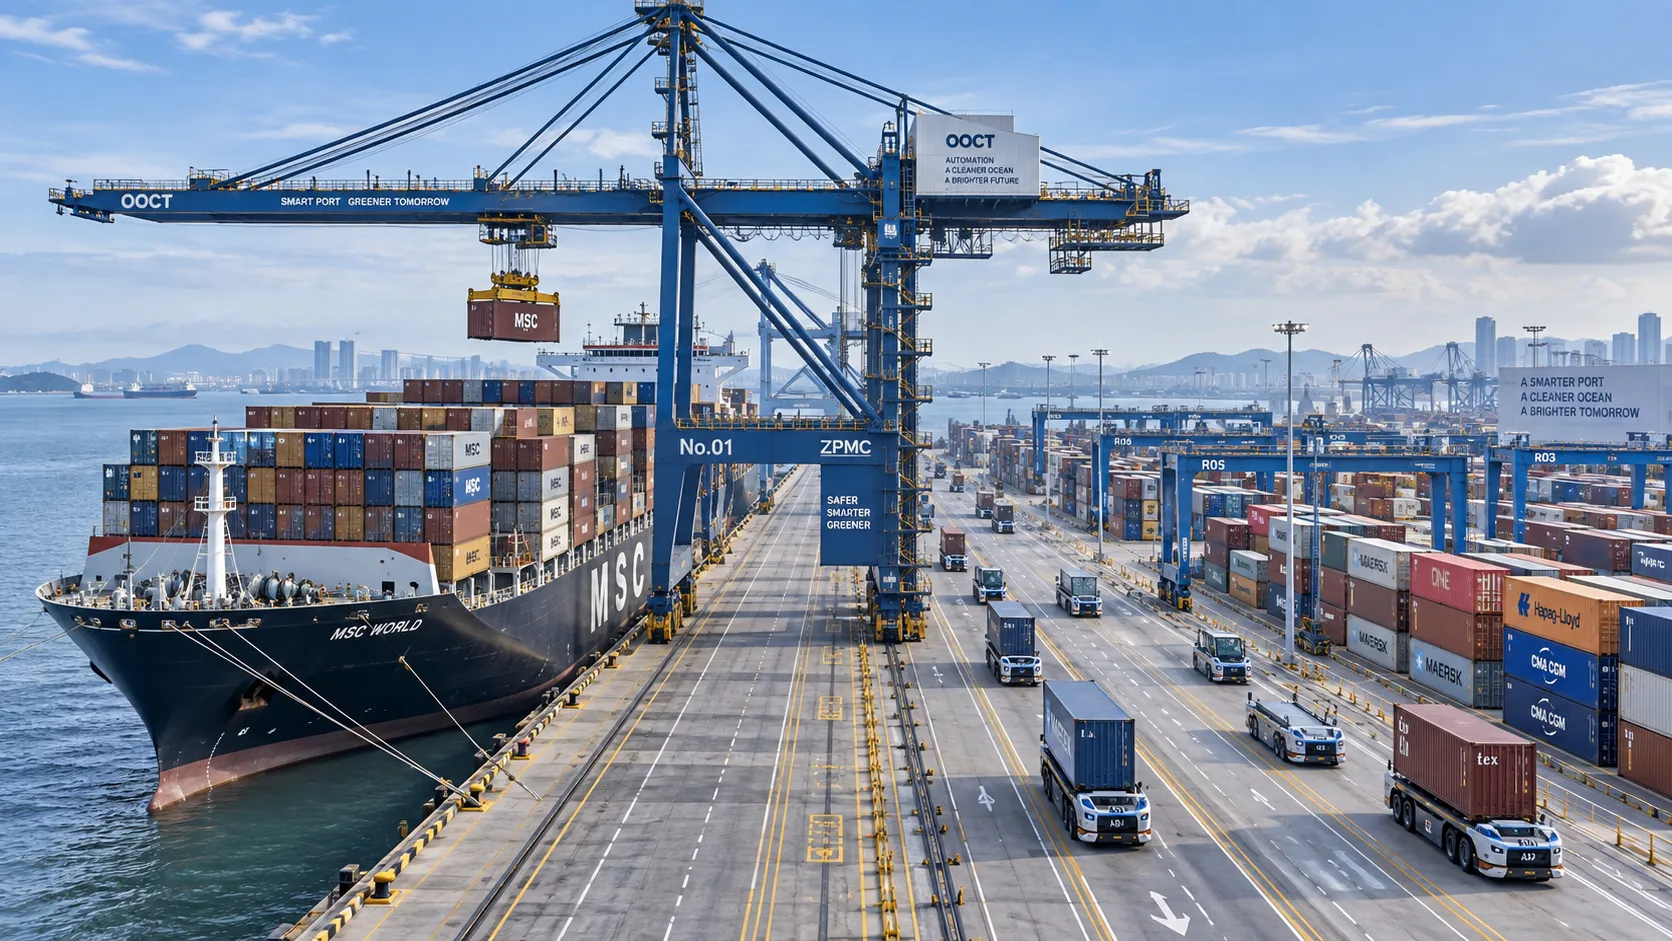
How to Specify a Quay Crane for Container Terminals by Vessel Size and Throughput?
Quay crane for container terminals: learn how to match outreach, lift height, capacity, automation, and cycle performance to vessel size and throughput goals.
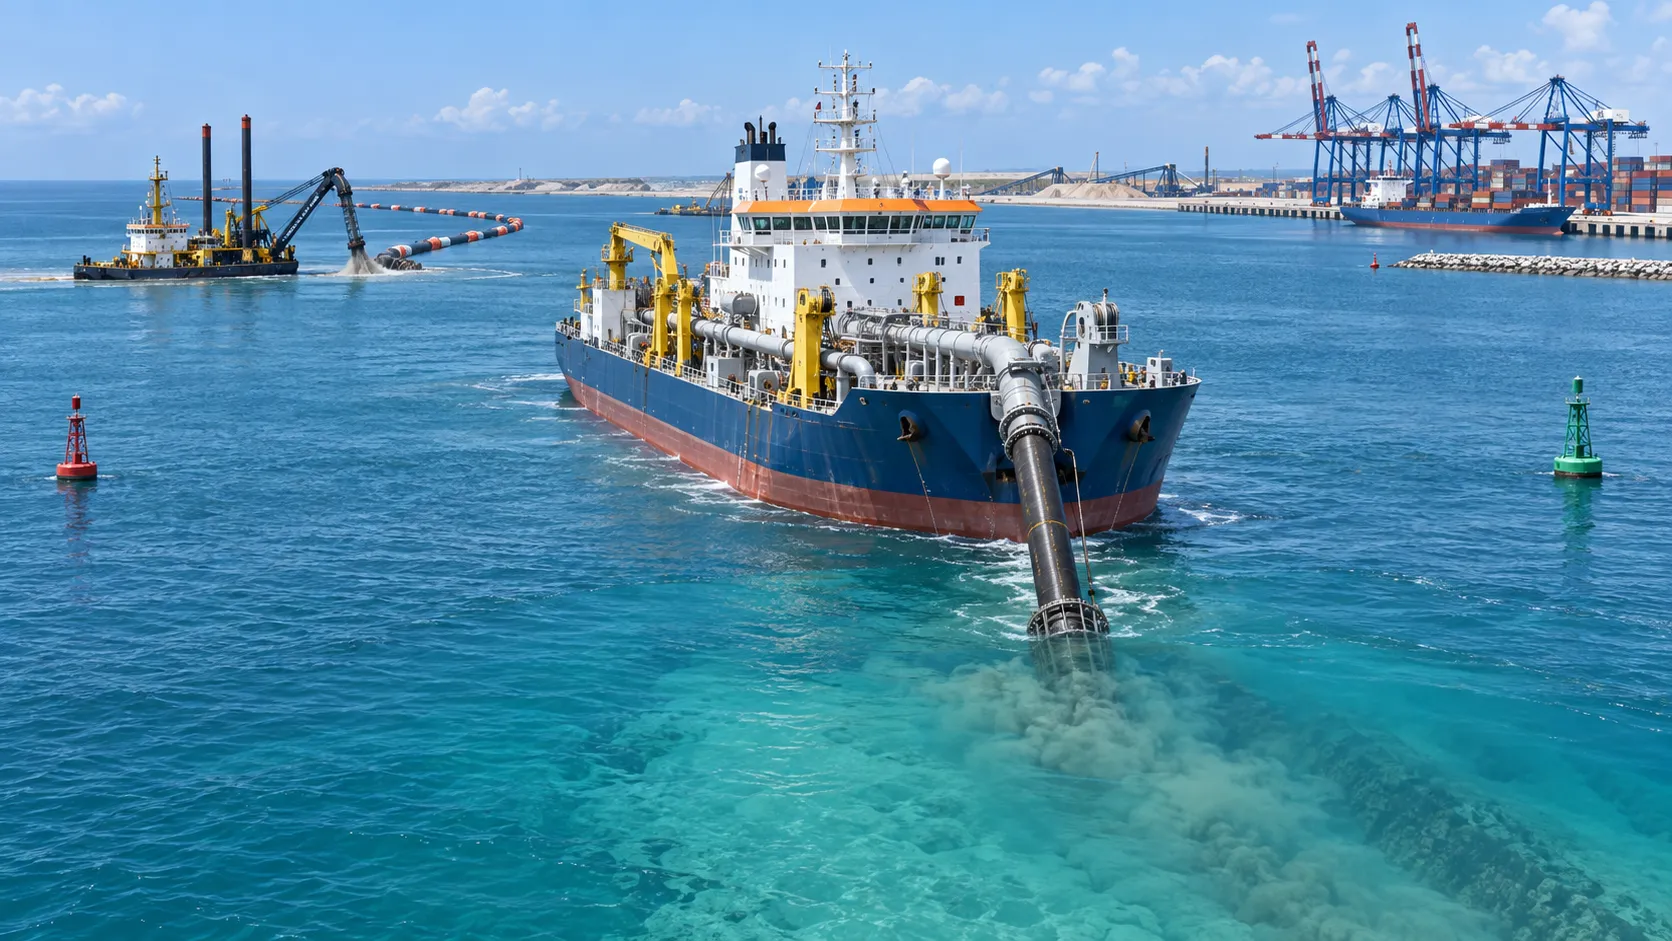
What Dredging Equipment Is Needed for Channel Deepening?
What dredging equipment is needed for channel deepening? Explore dredgers, pipelines, survey tools, and planning strategies for safer, more efficient port access.
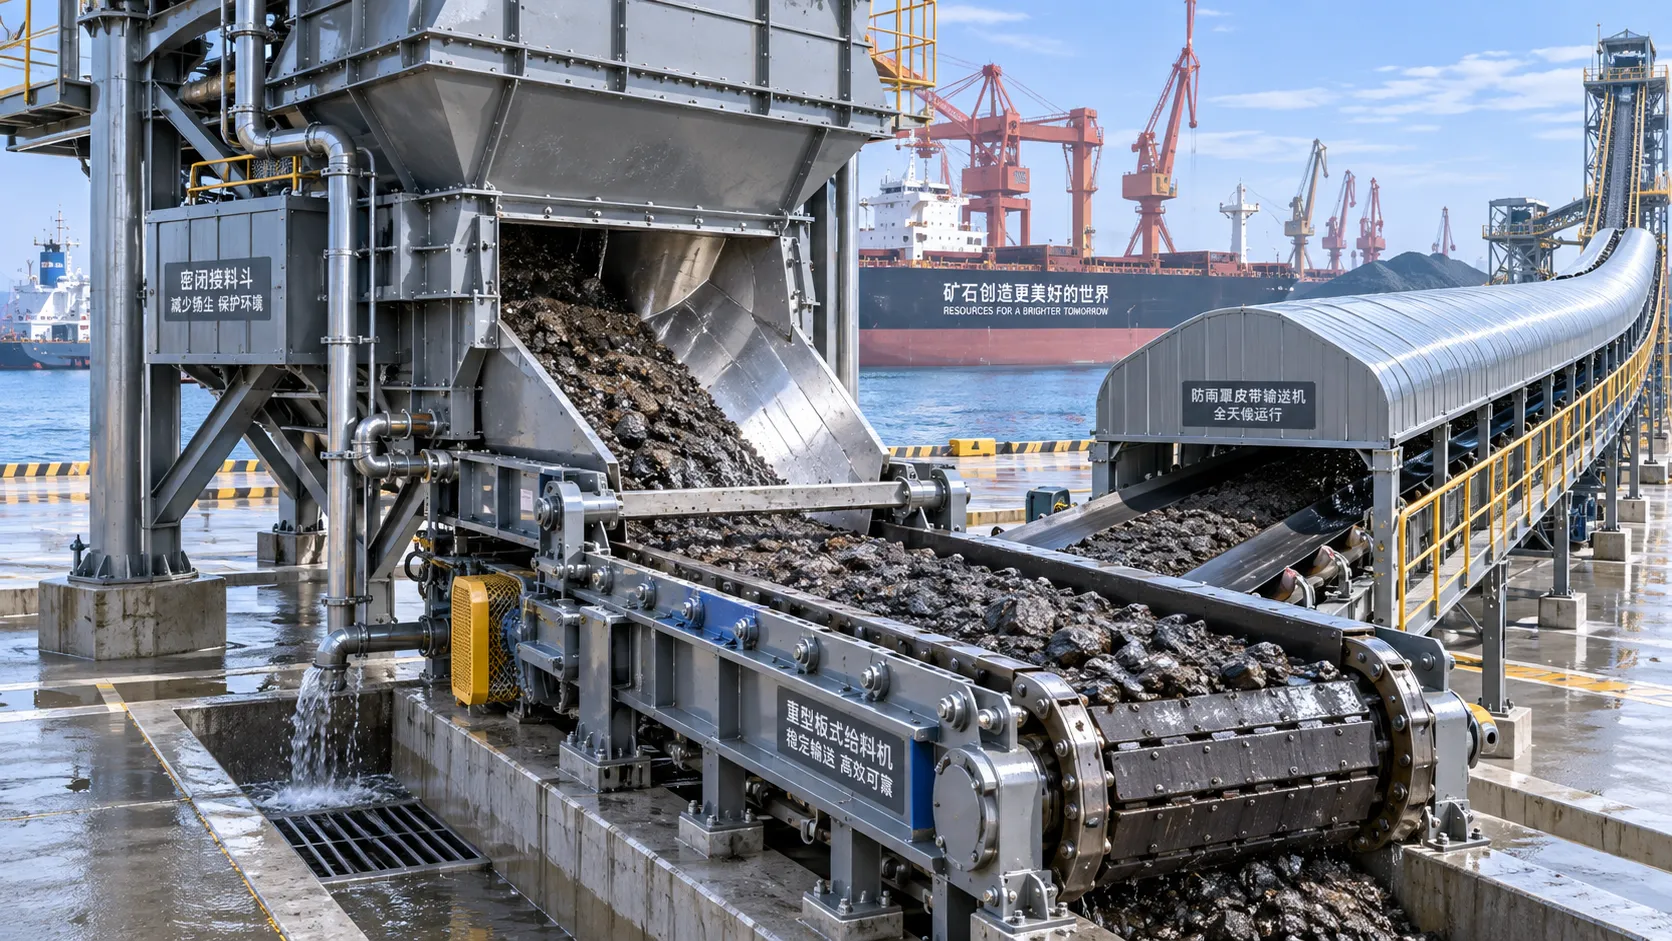
Which Bulk Handling Equipment Suits High-Moisture Cargo?
Which bulk handling equipment suits high-moisture cargo? Compare belt, apron, screw, drag, and slurry systems for reliable flow, less carryback, and higher terminal uptime.
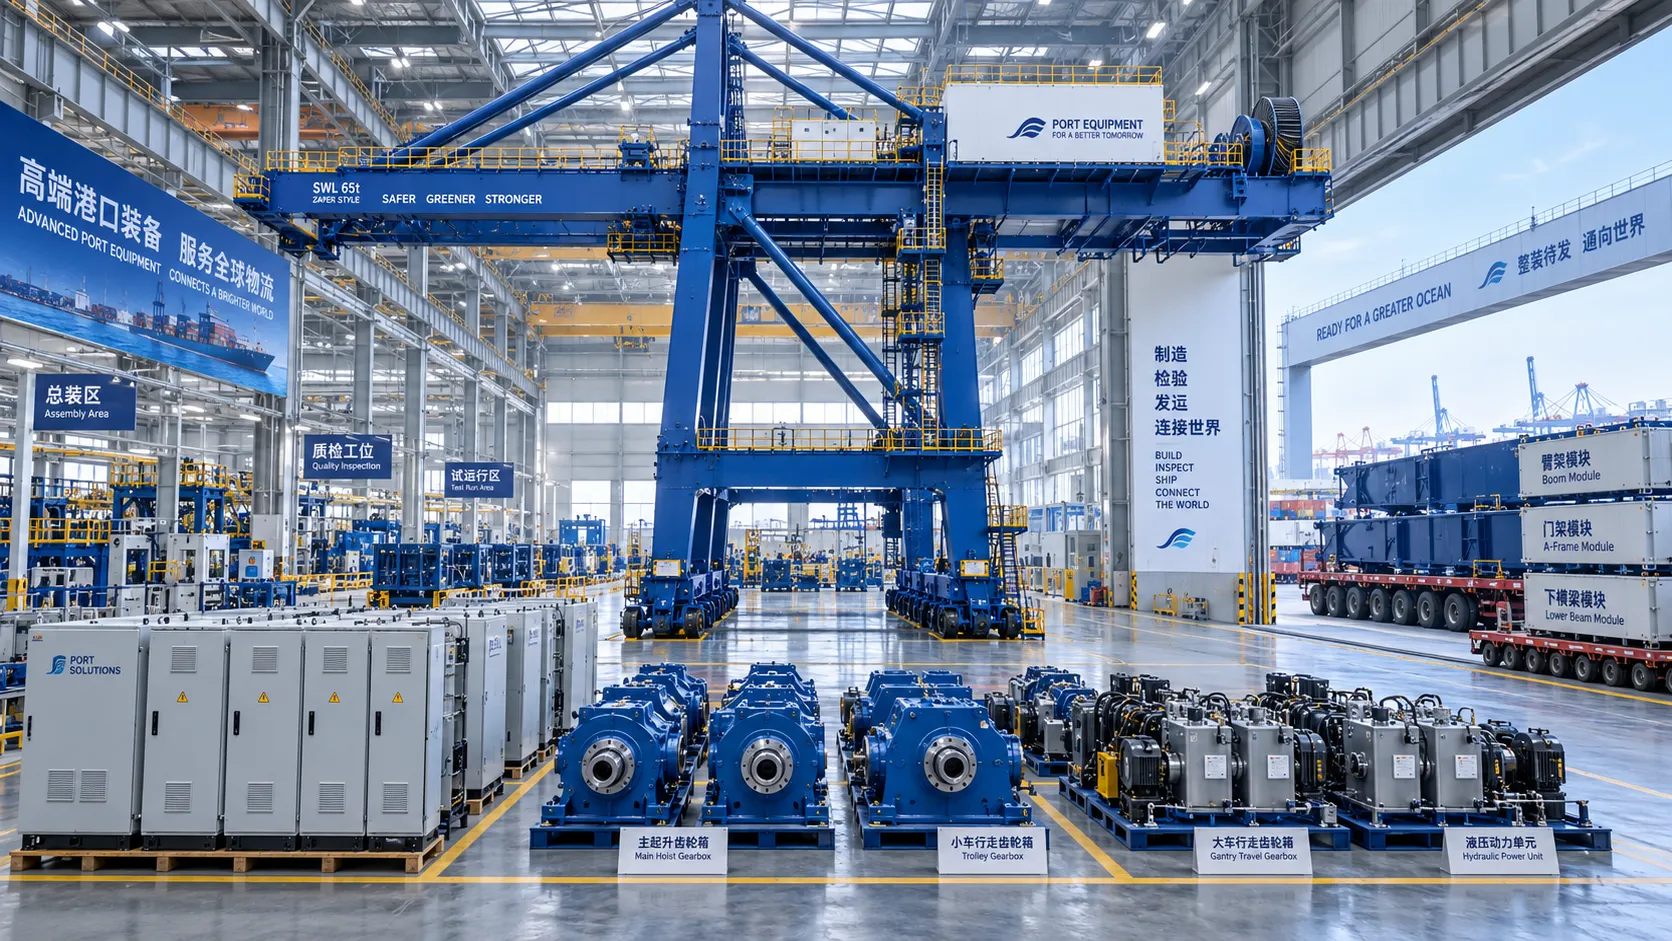
How Can Port Equipment Lead-Time Risk Be Managed?
How can port equipment lead-time risk be managed? Explore practical strategies to control critical paths, suppliers, transport, site readiness, and commissioning delays.
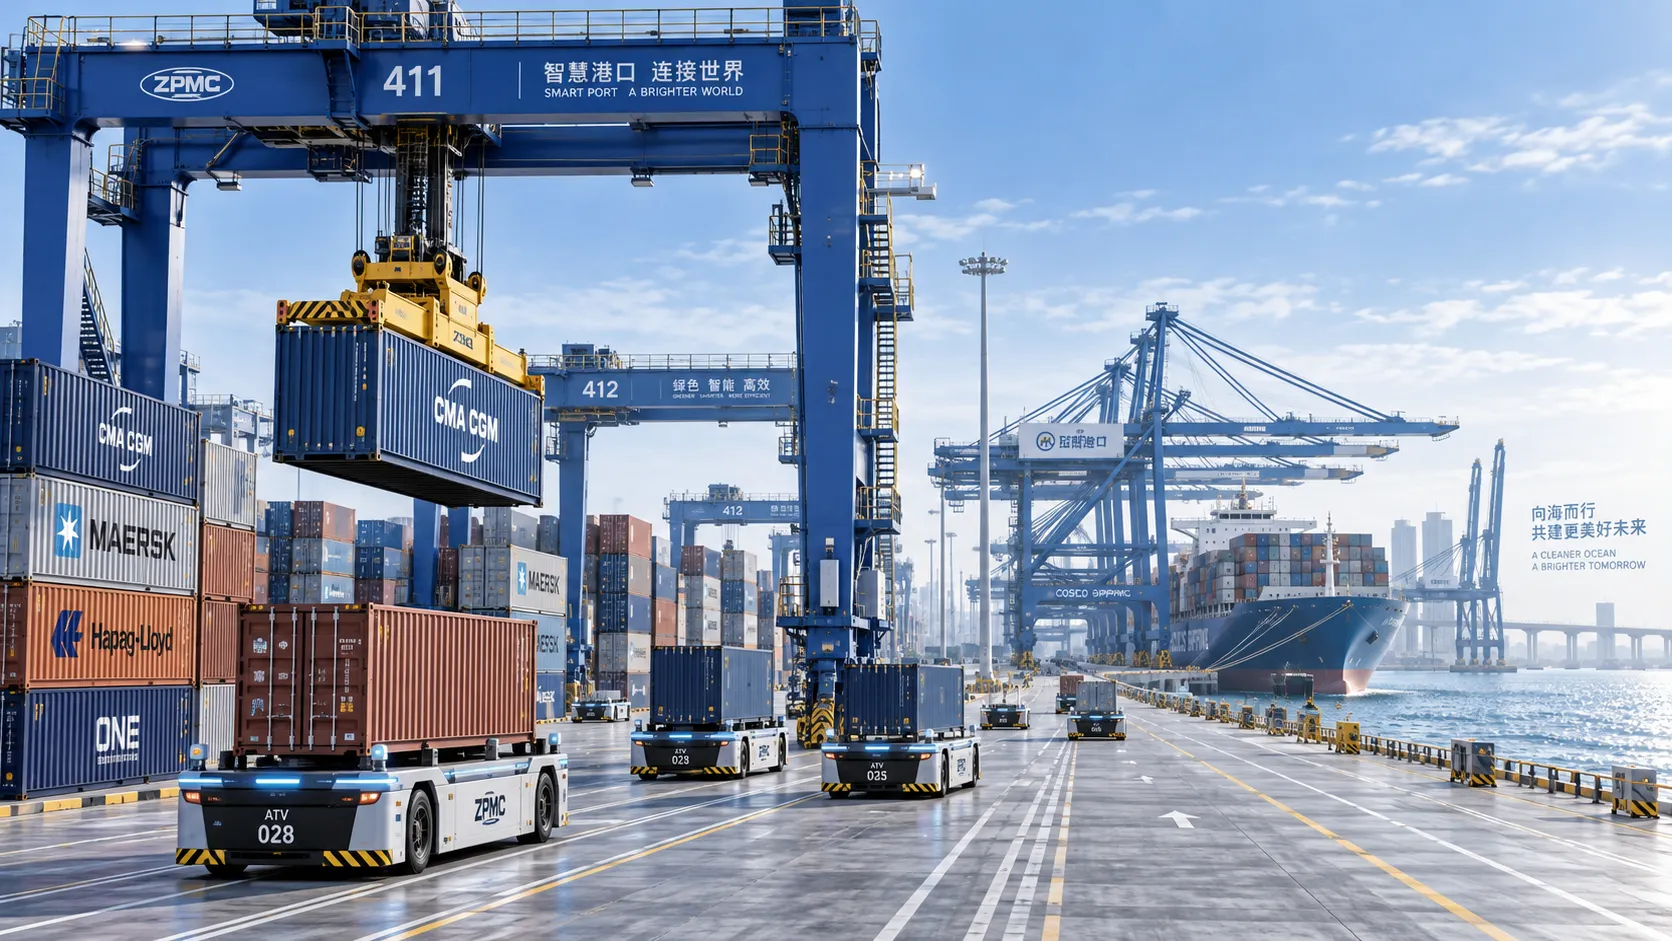
Terminal Automation Technologies That Raise Container Throughput Without Yard Disruption
Terminal automation technology that increases container throughput without disrupting yard flow. Explore smarter integration, resilient workflows, and phased deployment strategies.
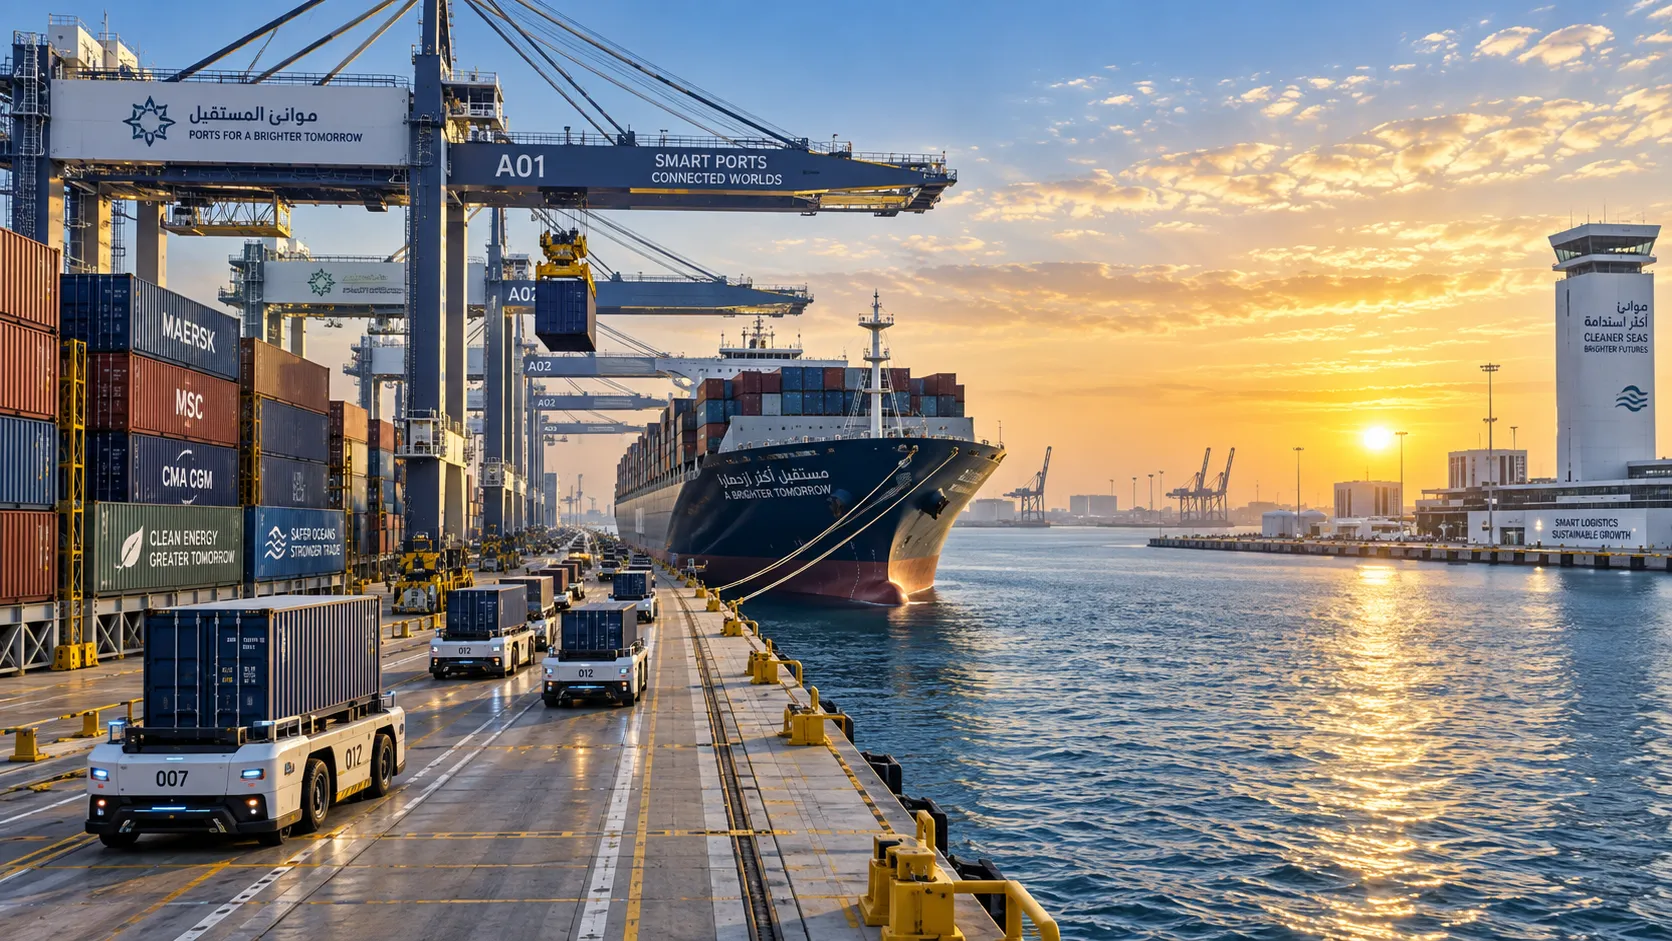
Middle East Port Automation: Key Market Drivers, Projects, and Investment Risks
Port automation systems Middle East: explore market drivers, flagship projects, integration challenges, and investment risks shaping smarter, resilient terminals.
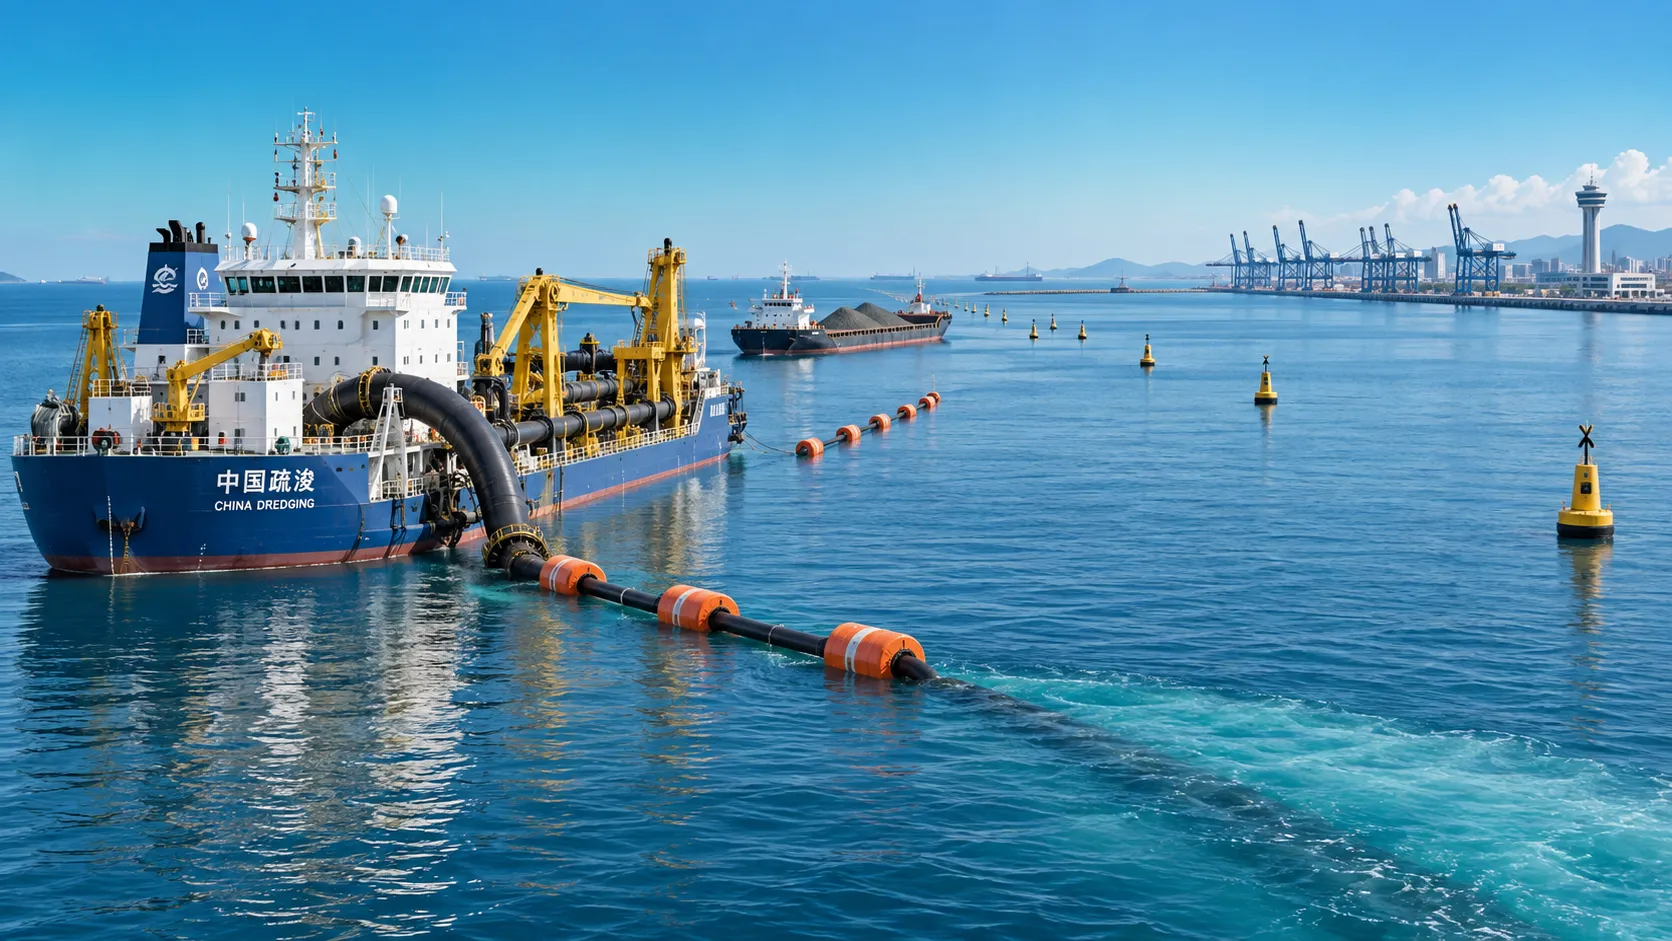
Planning Offshore Dredging Operations: Key Risks, Methods, and Project Controls
Offshore dredging operations demand smart planning. Explore key risks, proven methods, environmental controls, and project strategies for reliable delivery.