Related News
- 00
0000-00
How to Specify a Quay Crane for Container Terminals by Vessel Size and Throughput? - 00
0000-00
Which Bulk Handling Equipment Suits High-Moisture Cargo? - 00
0000-00
Terminal Automation Technologies That Raise Container Throughput Without Yard Disruption - 00
0000-00
Planning Offshore Dredging Operations: Key Risks, Methods, and Project Controls - 00
0000-00
Where Do Automated Guided Vehicles Deliver the Fastest Warehouse Gains in the Middle East?
How to Evaluate Port Terminal Equipment Systems for Throughput, Safety, and Lifecycle Cost
Evaluating port terminal equipment systems starts with a simple correction: rated capacity is never the full story. A terminal may buy larger cranes, faster carriers, or smarter controls, yet still lose moves because quay, yard, and gate assets do not perform as one system.
That matters more now because ports are under pressure from larger vessels, tighter berth windows, labor constraints, emission targets, and higher expectations for uptime. In this setting, equipment choices shape not only productivity, but also safety exposure, maintenance burden, and long-term competitiveness.
For organizations following the intelligence perspective of PS-Nexus, the question is broader than machinery selection. It is about how heavy equipment, control logic, yard flow, and infrastructure limits interact across the whole maritime logistics chain.
What should be included in the evaluation scope
Port terminal equipment systems usually include more than quay cranes. A realistic assessment covers ship-to-shore cranes, rubber-tired gantries, rail-mounted gantries, straddle carriers, reach stackers, terminal tractors, AGVs, power supply assets, and the digital systems coordinating them.
The software layer deserves equal attention. Terminal operating systems, crane control packages, fleet management tools, anti-collision functions, remote-control links, and condition monitoring platforms often determine whether hardware can deliver its promised value.
A narrow equipment review can miss the actual bottleneck. In practice, port terminal equipment systems succeed when transfer points are synchronized, exception handling is stable, and the site layout supports smooth container flow under daily variability.
Throughput is about sustained flow, not peak numbers
Throughput should be tested as a chain of movements. A quay crane can post impressive cycle times, but berth productivity still falls if yard handoff, truck exchange, or stack planning cannot absorb the pace.
Useful assessment starts with operating profile. Vessel mix, average call size, box density, reefer demand, twin-lift frequency, peak gate traffic, and yard dwell patterns all influence how port terminal equipment systems behave in real conditions.
Three throughput views are especially helpful:
- Nominal capacity: vendor-stated rates under controlled assumptions.
- Operational capacity: achievable rates with normal shift patterns and traffic conflicts.
- Resilient capacity: performance during weather disruptions, equipment outages, and schedule compression.
The last measure is often the most revealing. Ports do not operate in laboratory conditions. They operate under surge arrivals, uneven labor availability, mixed cargo priorities, and occasional communications faults.
This is why simulation and historical scenario testing are valuable. PS-Nexus often highlights the link between algorithmic scheduling and mechanical output, especially where AGV routing, crane dispatch logic, or buffer management can either release or restrict throughput.
Questions that expose real throughput potential
- What is the average move rate over a full shift, not a short demonstration window?
- How quickly does the system recover after a fault or traffic blockage?
- Which handoff point creates the first recurring queue?
- Can the yard system support future vessel size and stack density changes?
Safety must be evaluated as a system property
Safety in port terminal equipment systems is not limited to guards, alarms, and certifications. It also depends on visibility, traffic separation, fail-safe logic, braking performance, remote intervention design, and how people interact with automated equipment during exceptions.
Mixed environments are especially sensitive. Semi-automated yards, manual service vehicles, maintenance teams, and external trucks create transition zones where design assumptions often break down.
A serious review looks beyond compliance checklists. It asks how often a hazardous condition can emerge, how clearly it is detected, and how effectively the system contains it before damage spreads.
Remote operations add another layer. Low-latency communications, camera placement, sensor confidence, and operator workstation ergonomics directly affect safe handling. This is one reason digital architecture now belongs inside any technical evaluation, not beside it.
Lifecycle cost often overturns the lowest bid
Initial purchase price is visible. Lifecycle cost is where weak decisions become expensive. For port terminal equipment systems, cost should include energy use, maintenance labor, spare parts availability, software licensing, structural fatigue exposure, training time, and downtime losses.
Energy architecture is increasingly important. Electrified equipment may reduce fuel spend and emissions, but grid quality, charging strategy, cable management, and peak demand costs can materially change the business case.
The same applies to automation. Higher capital cost may be justified by steadier output, lower incident rates, and better labor utilization. But only if integration is mature and support capability is strong.
Core lifecycle cost categories
- Capital expenditure, commissioning, and infrastructure adaptation
- Power or fuel consumption under actual duty cycles
- Preventive and corrective maintenance workload
- Spare parts lead time and supplier network depth
- Software updates, cybersecurity controls, and interface support
- Residual value, modernization potential, and end-of-life disposal
A common mistake is treating downtime as a secondary cost. In container terminals, one recurrent control fault can erase the savings from a cheaper machine very quickly. Availability data should therefore be weighted heavily.
Where technical assessments usually uncover hidden risk
Most risks are found at interfaces. Crane to truck, truck to yard block, equipment to software, power supply to charging profile, and remote operator to field event are all points where port terminal equipment systems can underperform.
Infrastructure fit also needs close review. Rail gauge, pavement strength, berth geometry, wind profile, corrosion environment, and dredged depth constraints can change what equipment class is practical.
This is where the wider PS-Nexus perspective becomes useful. Port performance is influenced by coastal engineering, dredging support, and logistics node behavior as much as by machine specification. A terminal upgrade may fail if the waterside approach, yard density, or inland evacuation path is already limiting flow.
Signals that deserve closer checking
- High advertised move rates with limited long-shift proof
- Custom interfaces that rely on one vendor team
- Automation claims without clear fallback procedures
- Battery or electrification plans without grid modeling
- Low spare inventory support in the target region
A practical framework for comparing options
The strongest comparisons use a weighted matrix tied to site realities. Generic scoring often hides the factors that actually drive value.
A balanced framework for port terminal equipment systems can include the following dimensions:
Weighting should reflect strategic direction. A greenfield automated terminal may prioritize controls integration and remote operations stability. A brownfield upgrade may place more value on retrofit complexity, training burden, and phased commissioning risk.
How to move from evaluation to a defensible decision
A sound decision process usually starts by mapping actual demand patterns rather than copying another terminal’s configuration. Equipment that works in one port may underdeliver in another because vessel mix, weather, labor model, and land constraints differ.
Next, align equipment review with process mapping. Trace each container move from berth to stack to gate, then test where alternative port terminal equipment systems change delay, risk, and cost.
After that, validate vendor assumptions aggressively. Ask for shift-level evidence, maintenance records, integration architecture, cybersecurity provisions, and references from comparable sites.
The final step is to compare options against a future operating model, not only today’s workload. Expansion readiness, digital compatibility, decarbonization path, and modernization flexibility often determine whether an asset remains valuable over twenty years.
For teams tracking maritime logistics through PS-Nexus, the most useful next move is to build a site-specific scorecard. Include throughput under disruption, safety at interfaces, software maturity, support depth, and full lifecycle economics. That turns equipment selection from a specification exercise into a durable operating decision.
Related News
Smart Port Systems in Southeast Asia: Investment Priorities and Adoption Barriers
Smart port systems Southeast Asia: discover investment priorities, adoption barriers, and practical steps to build resilient, connected, high-performing terminals.
How to Evaluate Terminal Efficiency Solution Suppliers for High-Throughput Operations
Choose a terminal efficiency solutions supplier with confidence. Explore proven criteria for throughput, integration, lifecycle cost, safety, and reliable delivery.
How to Specify a Quay Crane for Container Terminals by Vessel Size and Throughput?
Quay crane for container terminals: learn how to match outreach, lift height, capacity, automation, and cycle performance to vessel size and throughput goals.
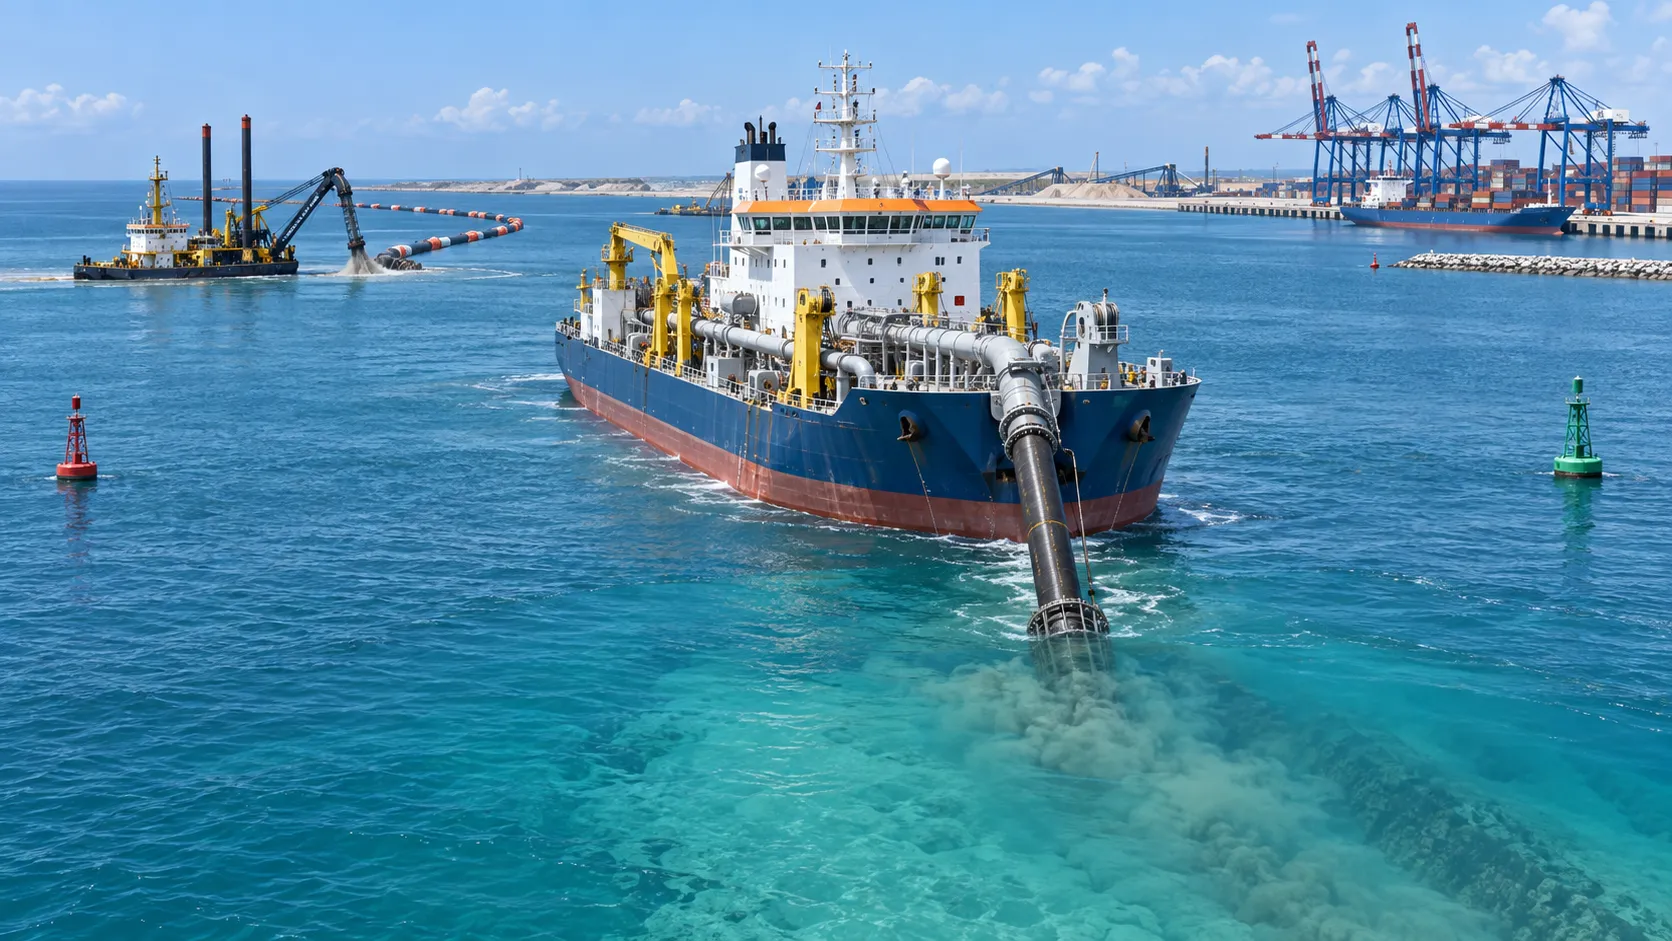
What Dredging Equipment Is Needed for Channel Deepening?
What dredging equipment is needed for channel deepening? Explore dredgers, pipelines, survey tools, and planning strategies for safer, more efficient port access.
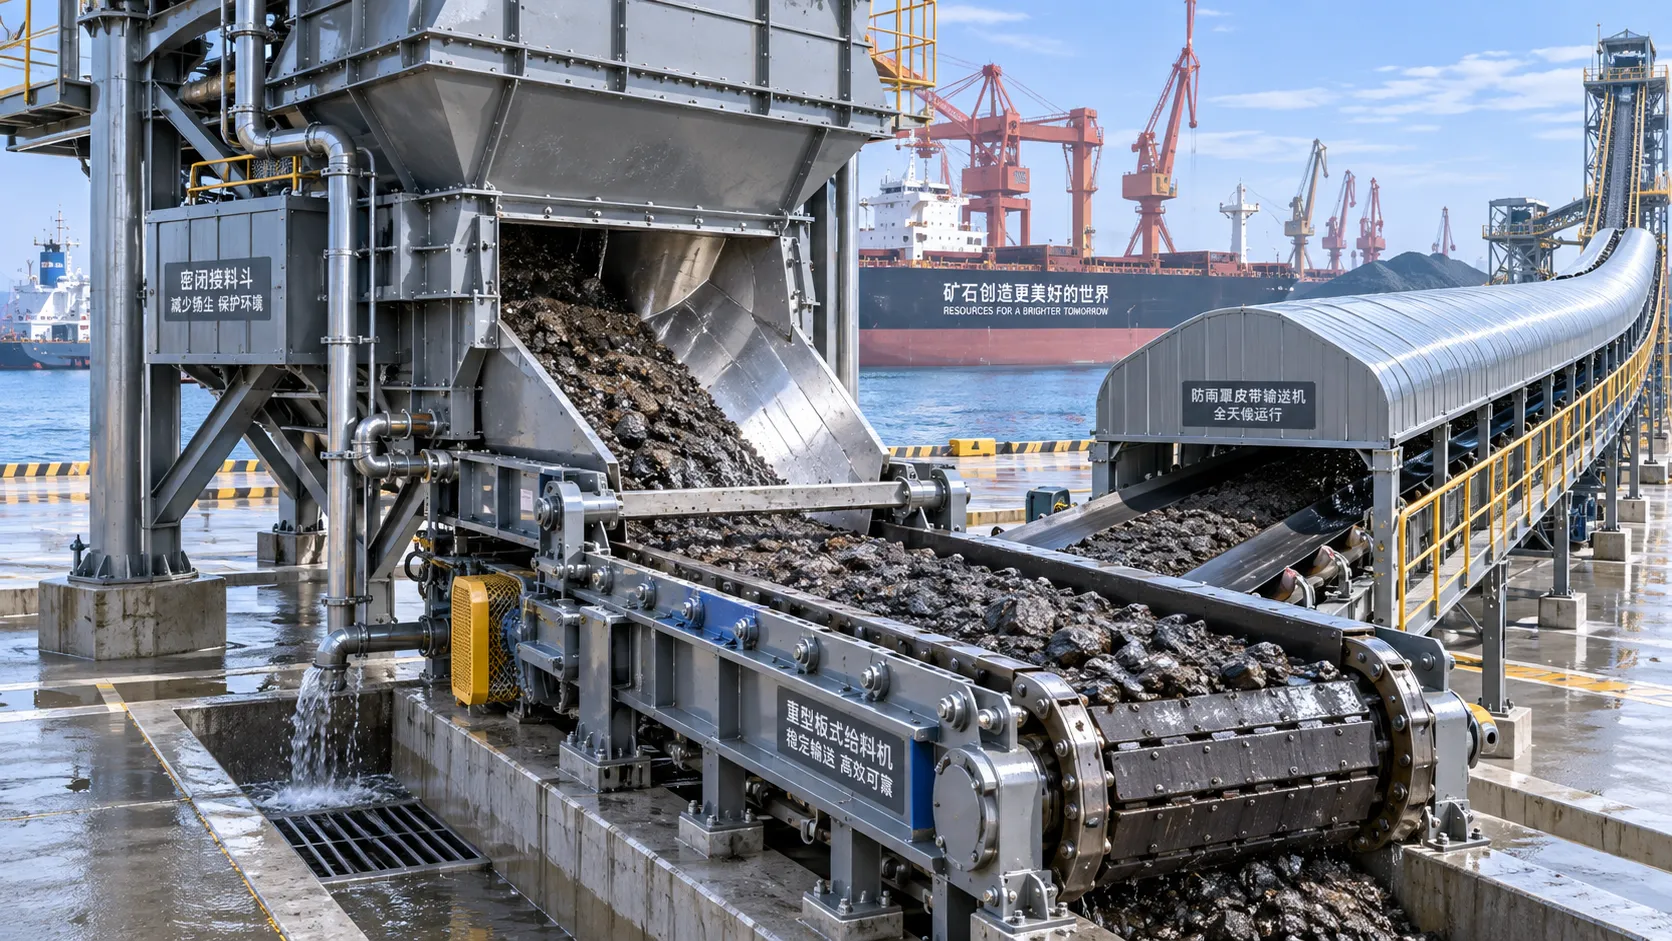
Which Bulk Handling Equipment Suits High-Moisture Cargo?
Which bulk handling equipment suits high-moisture cargo? Compare belt, apron, screw, drag, and slurry systems for reliable flow, less carryback, and higher terminal uptime.
How Can Port Equipment Lead-Time Risk Be Managed?
How can port equipment lead-time risk be managed? Explore practical strategies to control critical paths, suppliers, transport, site readiness, and commissioning delays.
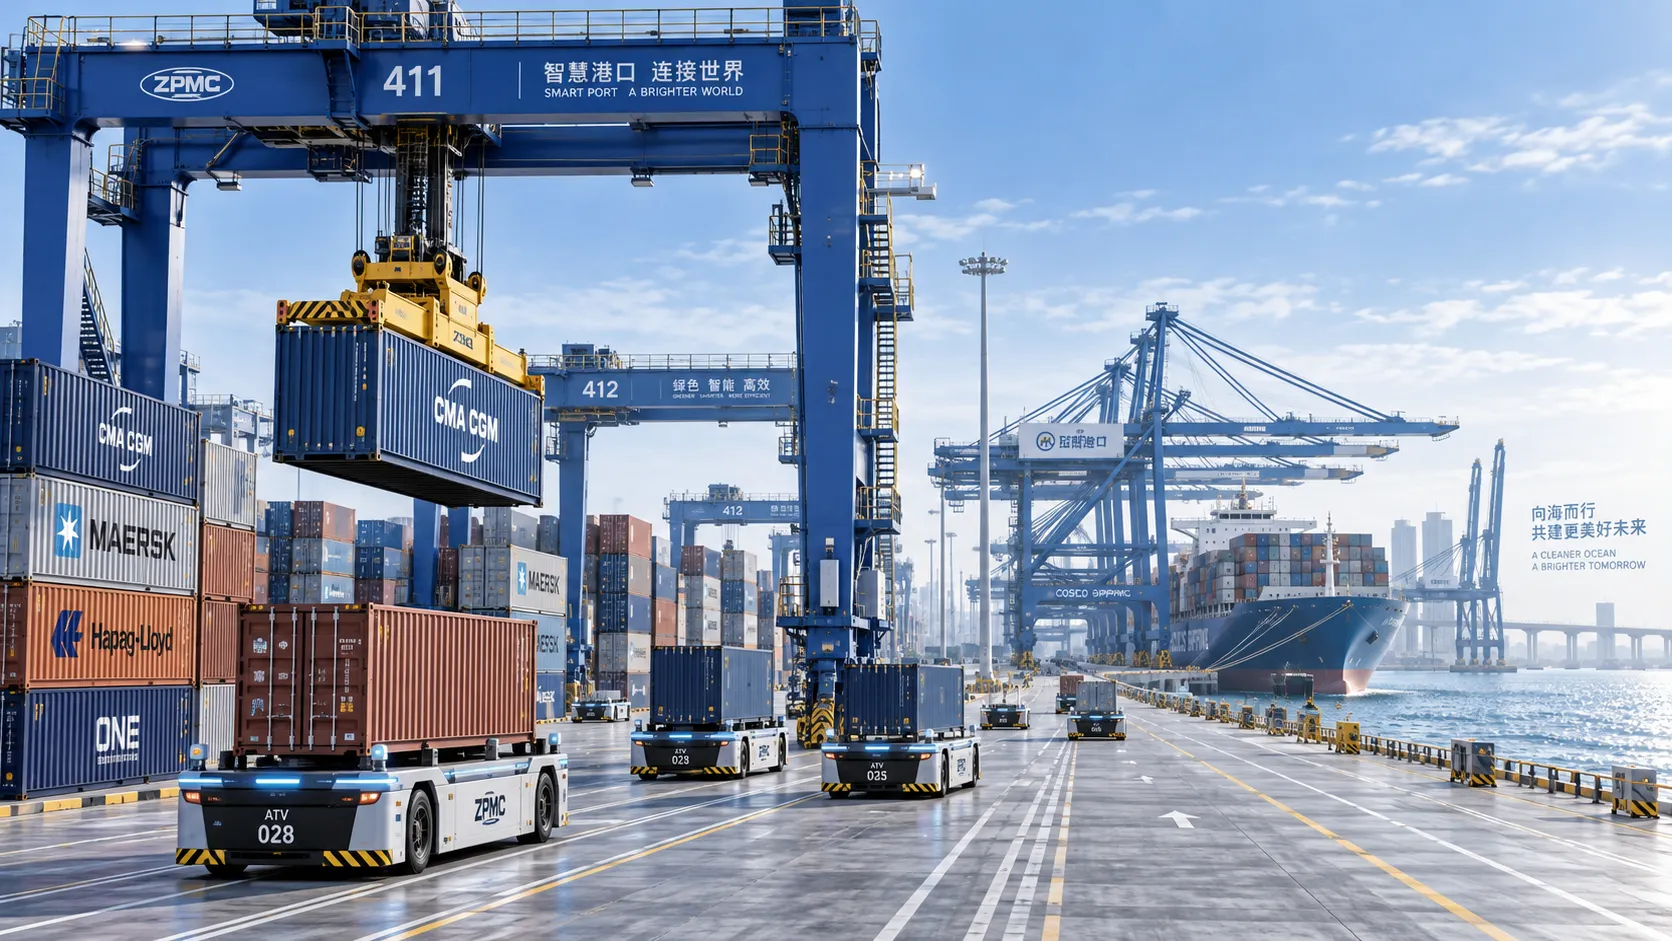
Terminal Automation Technologies That Raise Container Throughput Without Yard Disruption
Terminal automation technology that increases container throughput without disrupting yard flow. Explore smarter integration, resilient workflows, and phased deployment strategies.
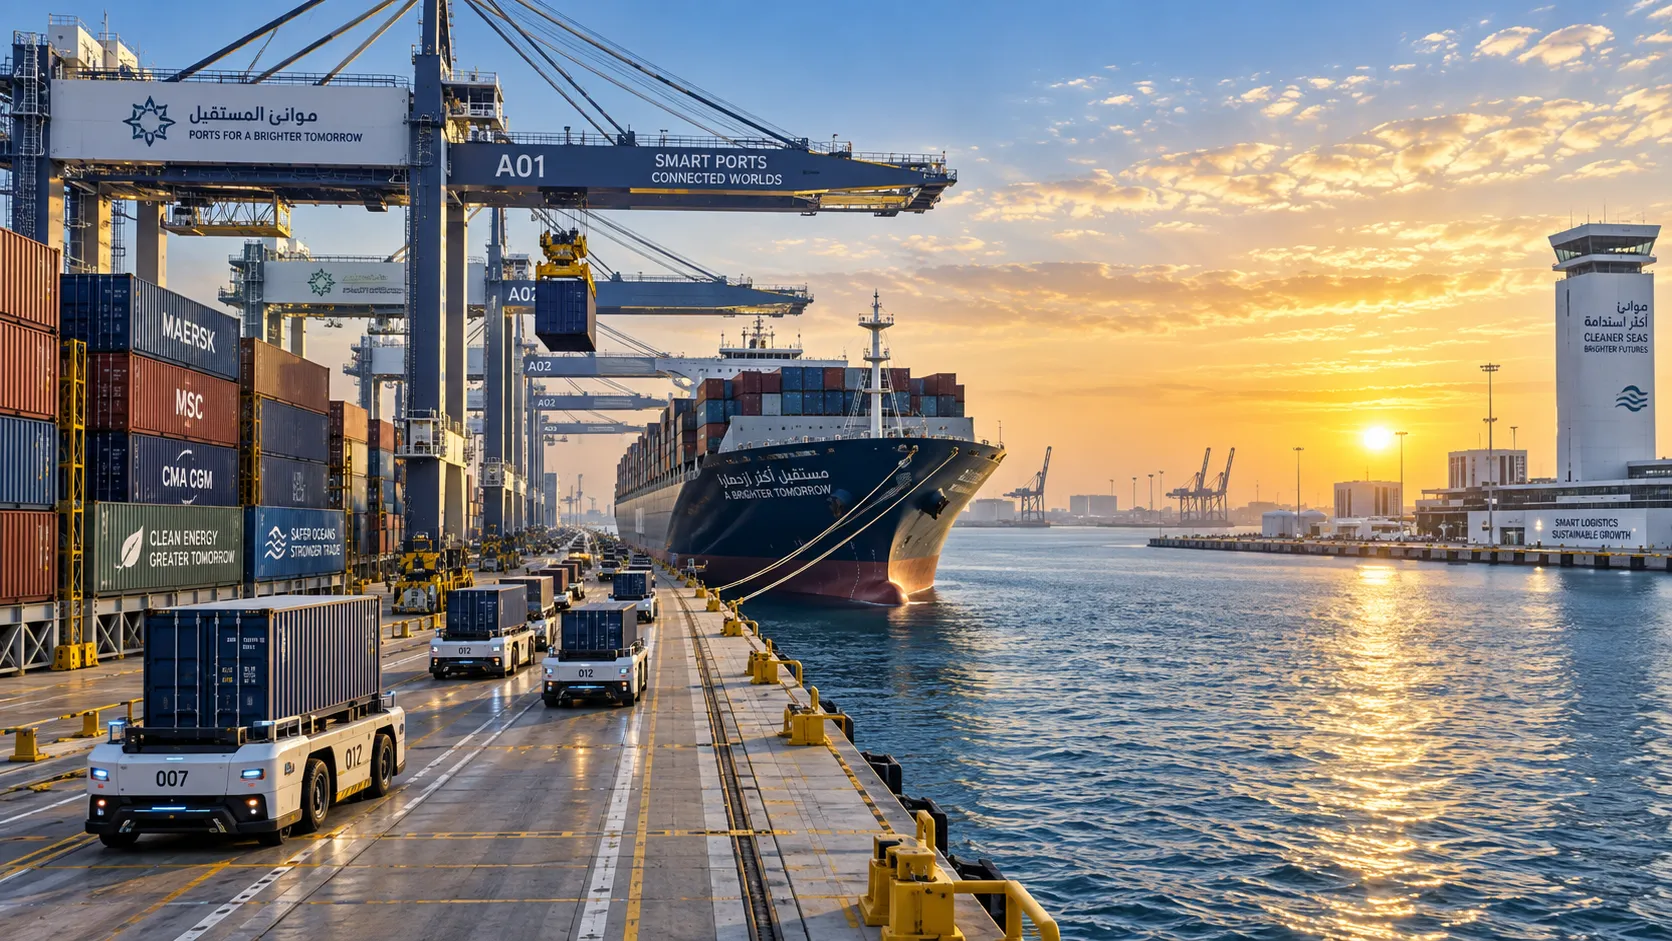
Middle East Port Automation: Key Market Drivers, Projects, and Investment Risks
Port automation systems Middle East: explore market drivers, flagship projects, integration challenges, and investment risks shaping smarter, resilient terminals.
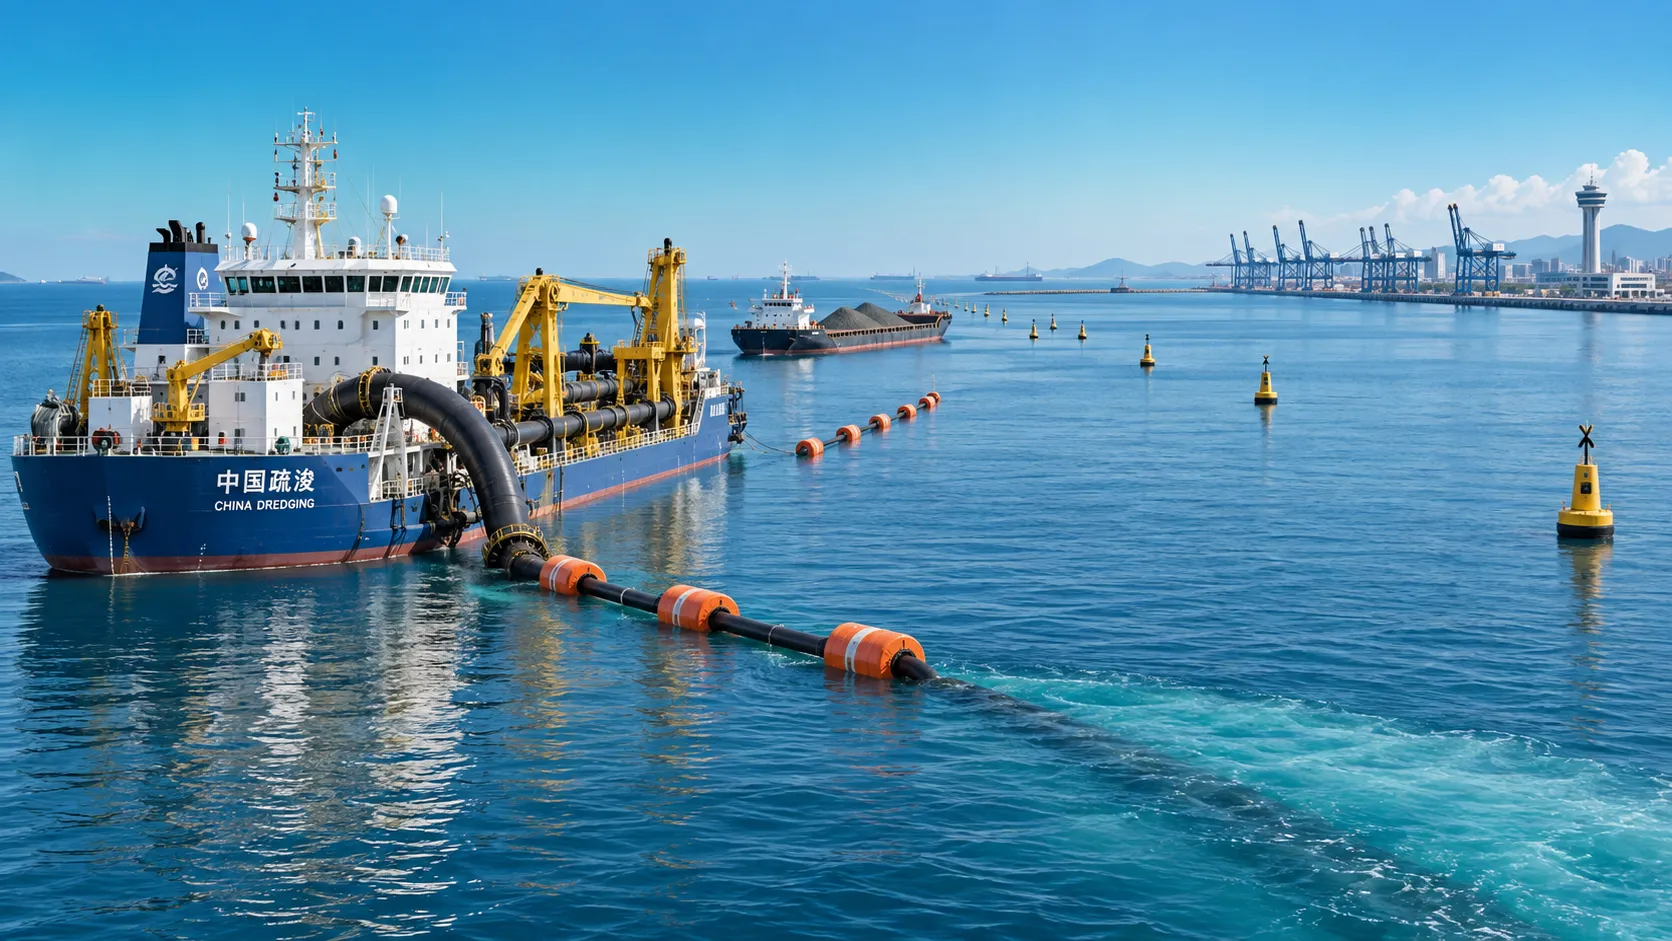
Planning Offshore Dredging Operations: Key Risks, Methods, and Project Controls
Offshore dredging operations demand smart planning. Explore key risks, proven methods, environmental controls, and project strategies for reliable delivery.