Related News
- 00
0000-00
How Can Port Equipment Lead-Time Risk Be Managed? - 00
0000-00
Maritime Logistics Operations: How Ports Can Reduce Container Dwell Time - 00
0000-00
What Does Logistics Node Monitoring Cost Across Warehouses and Transport Hubs? - 00
0000-00
How Can IoT Smart Port Solutions Improve Container Tracking and Yard Efficiency? - 00
0000-00
How Real-Time Port Logistics Intelligence Improves Container Yard Efficiency
What Does a Logistics Node Dynamics Provider Do for Multi-Site Supply Networks?
A logistics node dynamics provider turns changing conditions at ports, terminals, yards, warehouses, rail ramps, and inland transfer points into a usable operational picture for a multi-site supply network. The work is concerned with movement, constraints, and timing: where cargo or equipment is, what capacity is available, which handoff is delayed, and how a local disruption may affect connected locations.
In a network that spans several sites, each location can appear efficient when viewed alone while the overall flow remains unstable. A vessel may arrive within its revised window, but berth congestion can delay container discharge. The yard may then receive a concentrated volume of boxes that cannot be released on schedule because of rail slot limits, chassis shortages, customs holds, gate queues, or warehouse appointment conflicts. A logistics node dynamics provider connects those events so that the effect of one condition is assessed beyond the site where it began.
The term logistics node dynamics refers to the changing state of a physical transfer point and its surrounding connections. It includes current operating status, queue length, asset availability, expected arrival and departure times, handling productivity, storage pressure, route restrictions, weather exposure, maintenance outages, and exceptions that alter normal flow. The provider's role is to organize this information, test its relationships, and present it in a form that supports coordinated planning rather than isolated status reporting.
From Separate Events to Network Conditions
Multi-site supply networks rarely run on one operating system or one data standard. A marine terminal may record crane moves, berth windows, yard blocks, and container dwell time. A distribution center may focus on dock appointments, pallet positions, labor shifts, and outbound cut-off times. Inland transport may depend on GPS pings, electronic proof of delivery, driver hours, rail interchange messages, and road restrictions. Dredging activity, channel depth, tug availability, or lock schedules can also influence marine access in certain corridors.
A logistics node dynamics provider does not simply collect all of these records into a larger dashboard. Raw data can be misleading when timestamps use different time zones, equipment identifiers are inconsistent, or a status field has a different meaning at each site. “Available” could mean physically present, mechanically ready, released by the terminal, allocated to a job, or awaiting an inspection. Before the information can guide network-level action, the definitions must be aligned.
This normally involves creating a common operational model. Locations are mapped as nodes; transport lanes, feeder services, rail links, truck routes, and conveyor paths are modeled as connections. Assets such as quay cranes, automated guided vehicles, reach stackers, straddle carriers, pumps, trailers, and rail wagons are tied to their relevant operating area. Cargo is classified by movement requirements, including container type, dangerous-goods handling restrictions, temperature control, weight limits, project-cargo dimensions, or bulk-material characteristics.
The result is a live representation of dependencies. A blocked interchange does not remain an isolated rail event when it is likely to consume yard capacity at two terminals and postpone warehouse unloading slots. A maintenance shutdown on a ship loader can be evaluated against vessel arrival plans, stockpile levels, reclaiming capacity, and downstream customer commitments. The provider makes those relationships visible enough to examine before they become difficult to reverse.
The Operational Signals That Matter
Useful node intelligence combines physical, digital, and administrative signals. Physical signals describe assets and material flow. They may include crane operating state, equipment location, fuel or battery level, machine fault codes, pump pressure, conveyor speed, gate transaction time, berth occupancy, channel draft restrictions, or weather observations. Digital signals include terminal operating system events, transport management records, booking data, remote-control system alarms, and electronic interchange messages. Administrative signals cover inspection releases, access permissions, cargo documentation status, labor plans, maintenance work orders, and operating notices.
Signal quality matters as much as signal quantity. A location ping from a truck can be useful for estimated arrival time, but it does not prove that the vehicle can enter a terminal gate. A planned vessel time does not necessarily reflect the actual availability of a pilot, berth, crane gang, or tidal window. A provider therefore evaluates data freshness, source reliability, update frequency, and the operational meaning of each field.
- Time: planned, estimated, actual, and cut-off times must remain distinguishable. Replacing one with another destroys the ability to measure uncertainty.
- Capacity: nominal capacity is different from usable capacity. A yard block can have physical slots while still being impractical for a specific container class or retrieval sequence.
- Condition: an asset marked online may be operating with reduced speed, under a temporary work restriction, or awaiting a spare part.
- Priority: cargo urgency, vessel connection risk, refrigerated storage limits, and contractual handling rules can change the order in which work should be performed.
In automated terminals, the provider may also examine communication latency, command acknowledgements, vehicle route conflicts, sensor exceptions, and handover failures between control layers. These are not merely technical indicators. A delayed command or unavailable positioning reference can affect crane cycles, automated vehicle dispatching, stack density, and eventually gate release timing. Connecting control-system events to operational consequences is one of the more demanding parts of node analysis.
Coordinating Ports, Yards, and Inland Handoffs
Port operations create frequent examples of network dependence. A quay crane schedule influences discharge sequence. The discharge sequence changes where containers are placed in the yard. Yard placement affects rehandle demand, truck turnaround, rail loading order, and access to export stacks. If an inland depot has limited empty-container capacity, its condition can feed back into the port by slowing equipment return. A logistics node dynamics provider tracks these linked constraints instead of treating vessel work, yard operations, and inland dispatch as separate processes.
Bulk terminals require a different model. Commodity grade, moisture condition, stockpile segregation, conveyor compatibility, reclaiming sequence, ship-loader availability, dust controls, and sampling procedures may all affect whether material can move as planned. For dredging-related logistics, the relevant state can include cutter or pump condition, pipeline alignment, sediment characteristics, hopper capacity, disposal-area availability, wave conditions, and maintenance access. The analytical method remains similar: determine the current operating state, identify dependencies, and estimate the effect of a change on the next transfer point.
At a warehouse or inland cross-dock, the focus may shift toward appointment adherence, dock-door allocation, labor coverage, trailer staging, scan exceptions, and packaging constraints. The node is still connected to the larger network. A late inbound container does not only affect a receiving shift. It may prevent consolidation, miss a line-haul departure, create storage conflicts, or leave specialized handling equipment unused at another location.
This coordination is especially useful when planned flows cross several ownership boundaries. The data may originate from port authorities, terminal operators, carriers, rail operators, inland depots, maintenance contractors, and public traffic sources. Each party has a different operational view and may update records on a different schedule. The provider's function is to preserve the source context while establishing a common sequence of events.
Prediction, Scenarios, and Asset Scheduling
Real-time visibility describes the current situation; predictive work considers what may happen next. A logistics node dynamics provider can use historical cycle times, current queues, equipment status, route conditions, booking volumes, and planned arrivals to estimate likely pressure points. Such estimates should be treated as conditional forecasts rather than fixed promises. A forecast is only as credible as its assumptions about resource availability, operating rules, and external conditions.
For example, a terminal's estimated container release time may depend on discharge completion, inspection status, yard retrieval position, truck appointment availability, and gate capacity. If any input changes, the estimate should be recalculated and the reason for the revision should remain traceable. A black-box prediction that cannot explain its inputs is difficult to use when an operations team needs to distinguish a real constraint from a data error.
Scenario analysis is often more useful than a single prediction. One scenario may assume that a crane returns after a short corrective repair. Another may assume that the machine remains unavailable through a shift change. The difference can be assessed against alternative berths, storage zones, rail windows, trucking capacity, and cargo priorities. In the same way, a low water level or severe weather forecast can be considered alongside revised vessel drafts, convoy arrangements, or deferred loading plans.
Asset scheduling draws on this scenario work. Equipment allocation is not simply a matter of assigning the nearest available machine. A rubber-tired gantry crane, for example, may need to remain in a block with time-sensitive export boxes; moving it to relieve another area could create a later bottleneck. Automated guided vehicles need battery charging opportunities, safe routes, and compatible pickup points. Dredging pumps and cutters need maintenance windows that account for wear, spare-part lead time, sediment conditions, and marine access. Good scheduling balances the immediate queue against the constraints that will exist later in the operating cycle.
Data Integration Needs Operational Discipline
Integration projects often fail because system connectivity is mistaken for operational consistency. Connecting application programming interfaces, telemetry feeds, spreadsheets, and event messages is necessary, but it does not settle questions such as which departure time is authoritative, whether a cancelled booking should remain in a capacity plan, or how long a stale equipment signal remains usable.
A practical operating model sets rules for ownership, validation, and escalation. Each critical data element needs a defined source, expected update interval, unit of measure, and exception treatment. Container dimensions, cargo weight, berth draft, pump flow, battery state of charge, and crane availability should not be converted or rounded without clear controls. A small unit mismatch can lead to a large planning error when it is multiplied across many moves or a long transport lane.
Event sequencing deserves special care. In physical logistics, messages can arrive out of order because of connection loss, delayed synchronization, or manual correction. A vehicle may send a gate-exit event after a later position update has already reached the platform. A maintenance work order can be closed administratively while the asset is still undergoing functional testing. The system needs to preserve both event time and receipt time, then apply rules that avoid replacing a reliable state with an older or less credible message.
Cybersecurity and access controls also affect node dynamics. Remote crane control, automated vehicle dispatch, terminal operating systems, and industrial sensor networks should not expose operating commands merely because status data is shared across sites. Separating observation, planning, approval, and control permissions limits the chance that an integration intended for visibility becomes an unsafe path into industrial equipment.
Common Misreadings of Node Performance
A frequent mistake is to judge a node by average throughput alone. High average crane moves, gate transactions, or rail lifts can conceal periods when queues become severe enough to disrupt connected sites. Variability often matters more than the average when transport schedules have narrow handoff windows. A node may also appear underutilized because work is constrained by a downstream bottleneck rather than by its own equipment.
Another error is assuming that more storage solves a flow problem. Additional slots can temporarily absorb volume, but they may increase rehandles, travel distance, search time, and equipment conflict. In a container yard, stack height, segregation rules, reefer connections, dangerous-goods requirements, and retrieval order determine whether space is operationally useful. In bulk handling, stockpile capacity can be constrained by quality separation, reclaiming geometry, or environmental controls.
Local optimization can create the same problem. Prioritizing a terminal's fastest moves may improve that terminal's daily figure while sending cargo to an inland site before dock capacity, labor, or transport appointments are ready. A network view tests whether a local acceleration reduces end-to-end delay or merely moves the queue elsewhere.
What the Provider Produces in Practice
The output is usually a set of operational views rather than a single report. A current-state view identifies active constraints and affected flows. An exception view groups events by urgency, confidence, and likely downstream impact. A planning view compares expected load against usable capacity over upcoming shifts or transfer windows. Asset views show whether equipment is available, restricted, in maintenance, or positioned where demand is forming.
For analysis to remain useful, every significant alert should retain a path back to the underlying event, source, and assumption. An alert that says a rail connection is at risk should expose the arrival estimate, planned departure cut-off, handling steps still required, and the rule used to classify the risk. This traceability allows operations personnel to correct bad inputs, challenge weak assumptions, or choose a different response without relying on a vague status color.
Across a multi-site supply network, the provider's central task is to turn changing node conditions into a shared operational language. That language links heavy equipment, software events, cargo rules, transport timing, and physical capacity. When it is maintained with disciplined data definitions and realistic operating assumptions, it gives a clearer basis for coordinating movement through ports, terminals, yards, and inland connections.
Related News
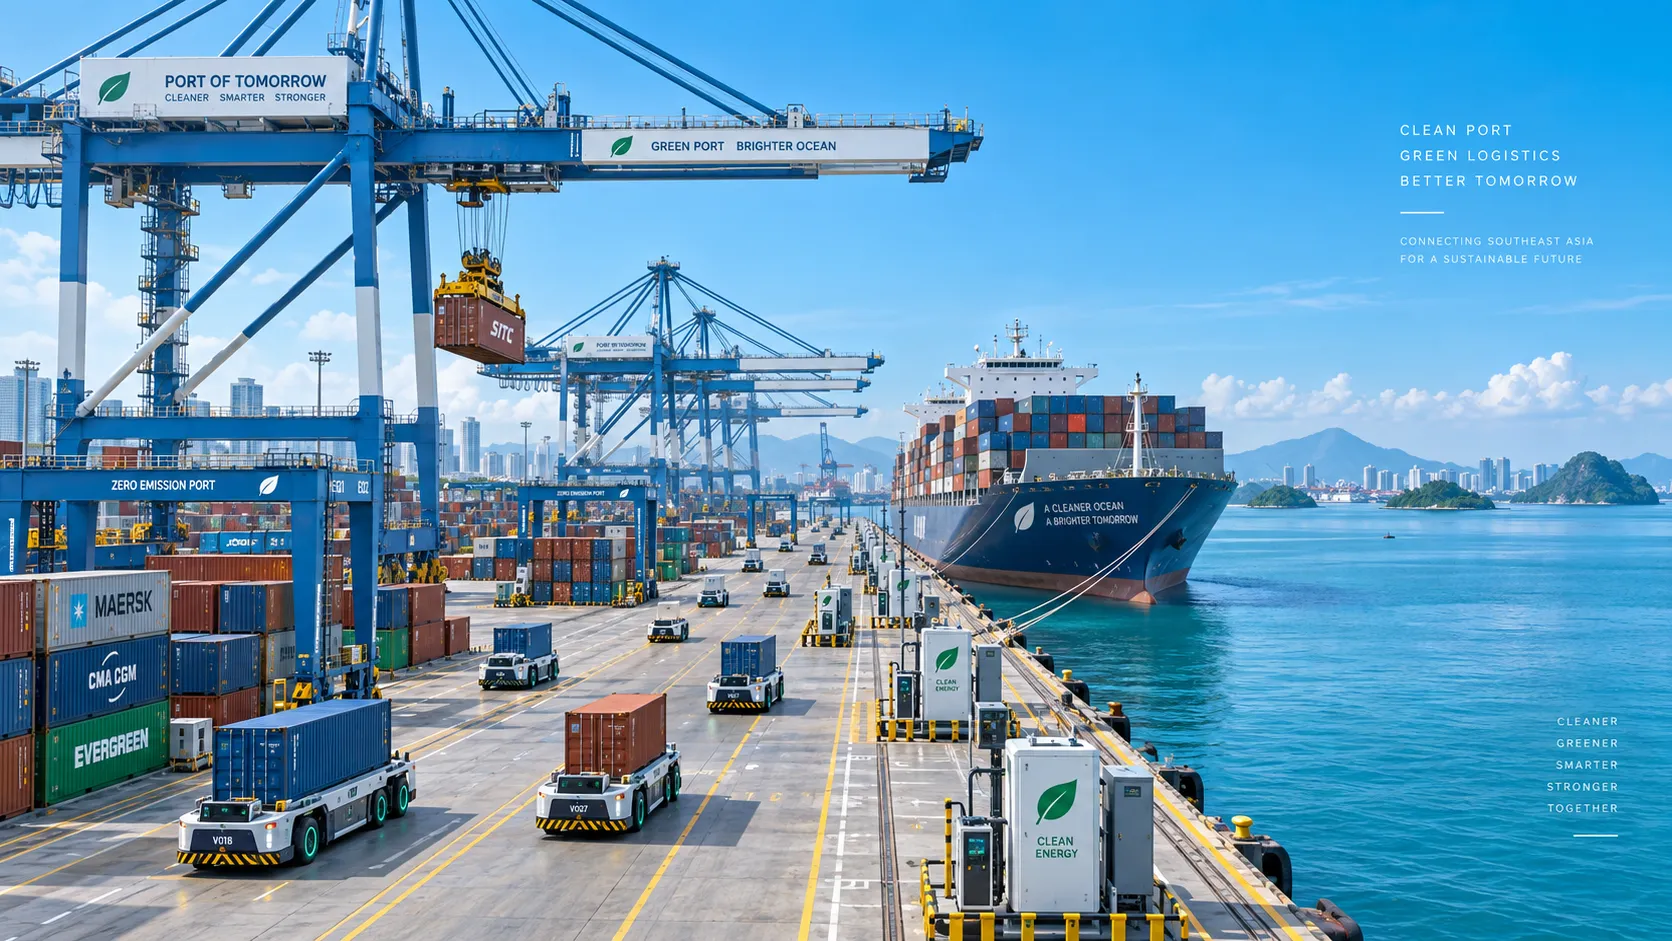
Smart Port Systems in Southeast Asia: Investment Priorities and Adoption Barriers
Smart port systems Southeast Asia: discover investment priorities, adoption barriers, and practical steps to build resilient, connected, high-performing terminals.
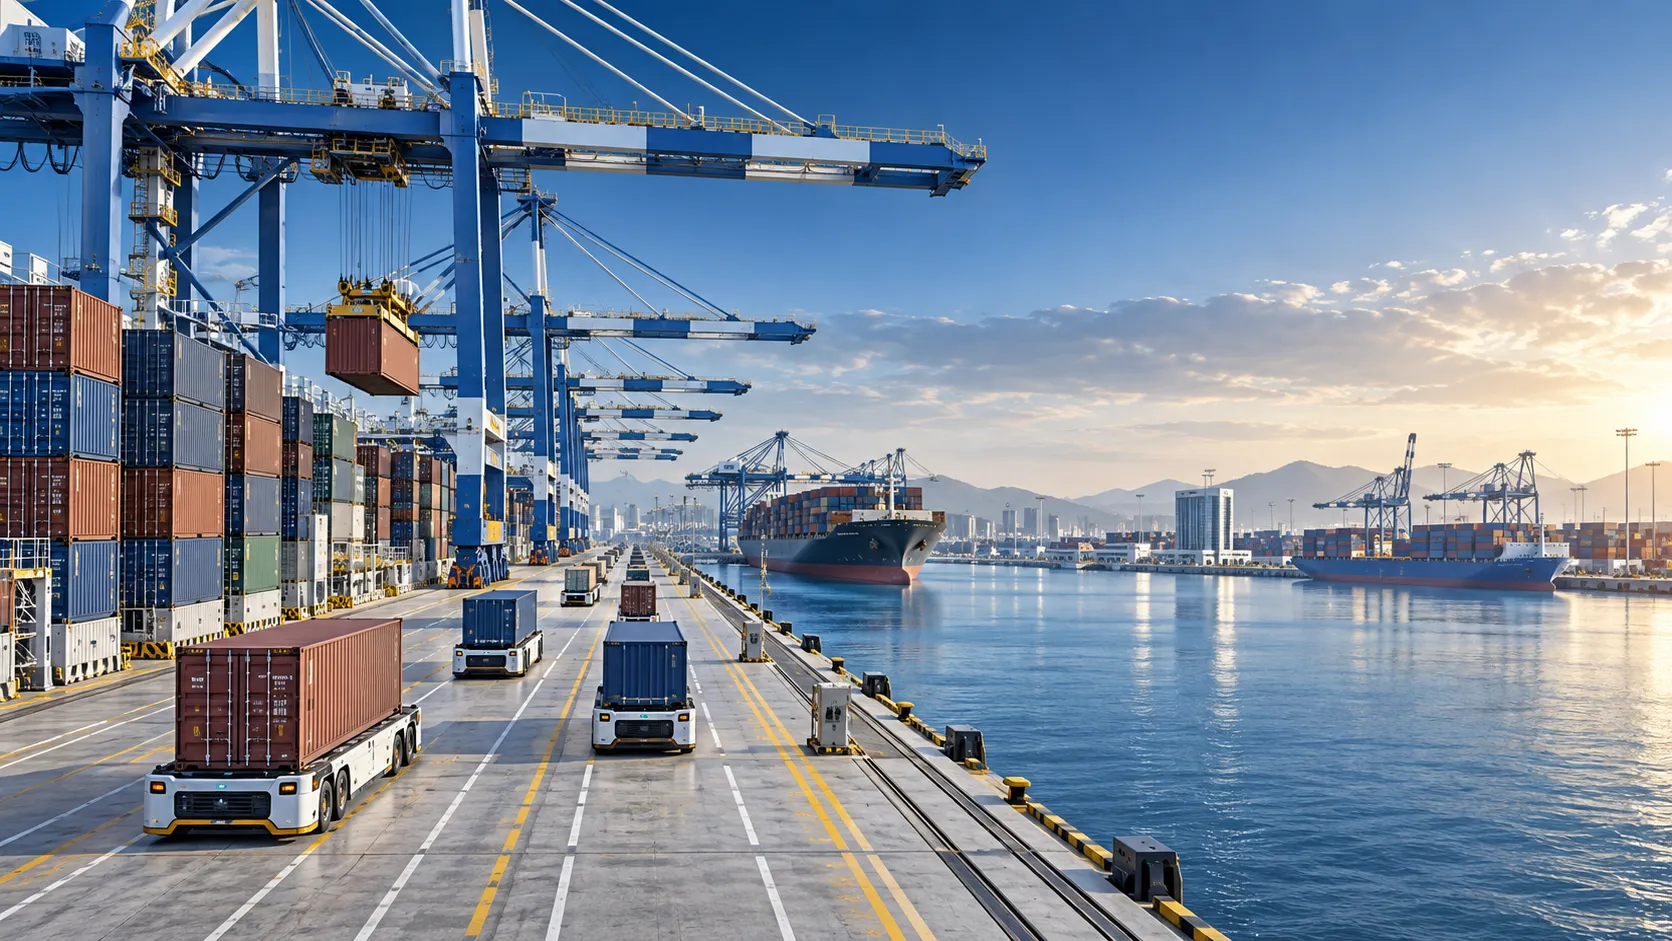
How to Evaluate Terminal Efficiency Solution Suppliers for High-Throughput Operations
Choose a terminal efficiency solutions supplier with confidence. Explore proven criteria for throughput, integration, lifecycle cost, safety, and reliable delivery.
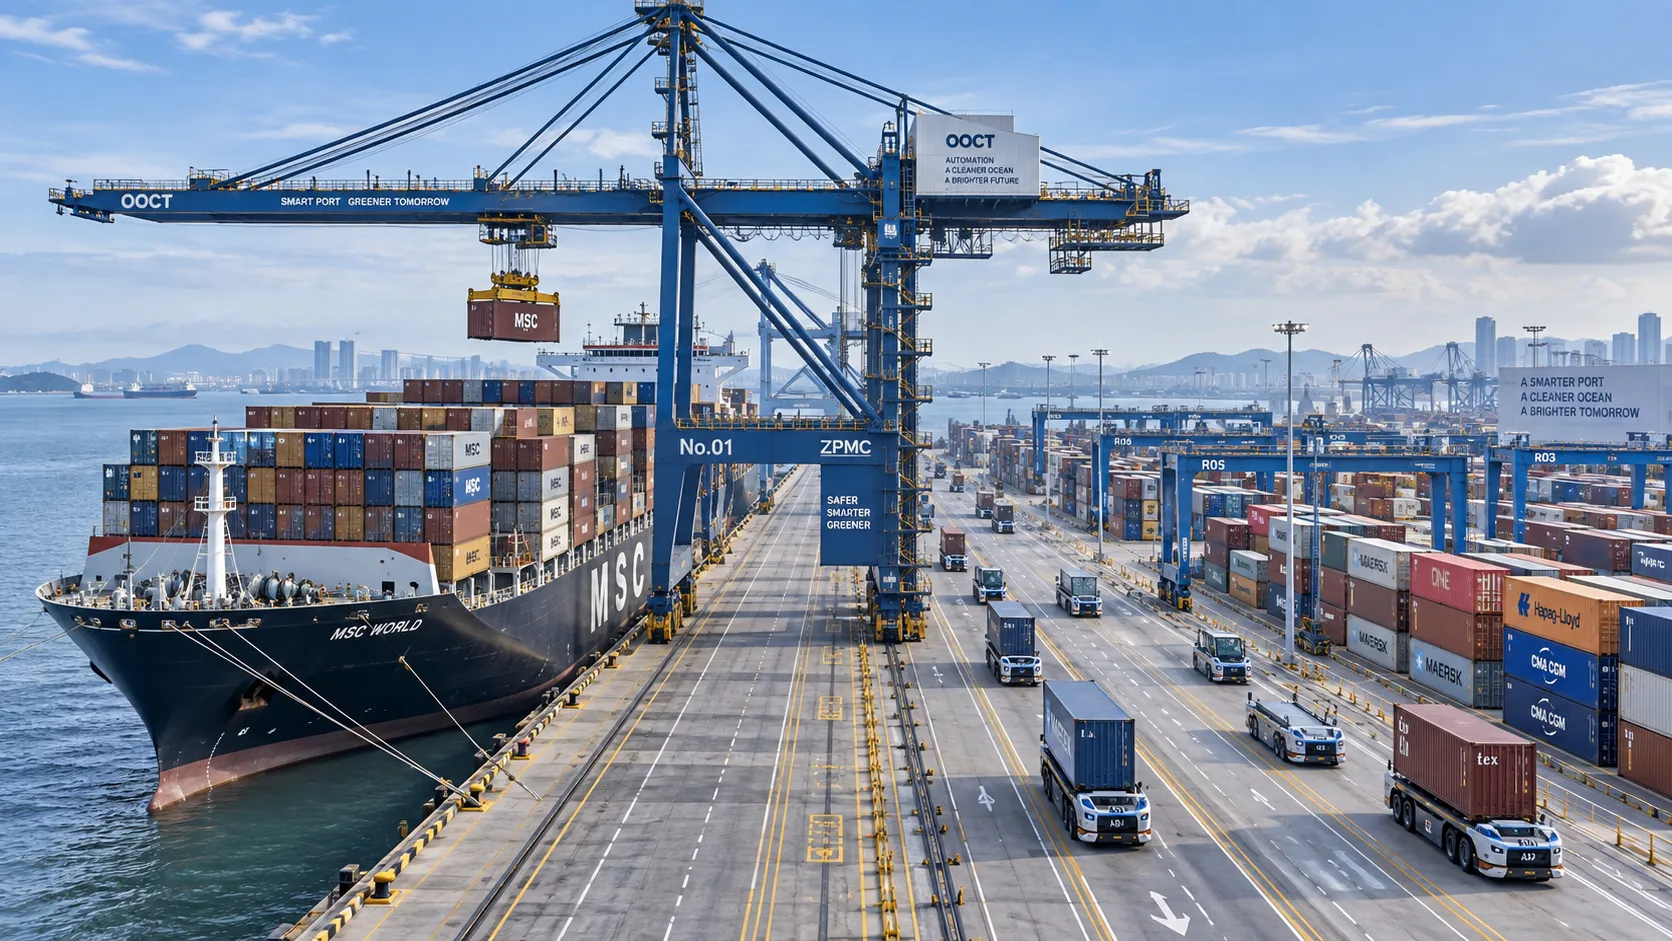
How to Specify a Quay Crane for Container Terminals by Vessel Size and Throughput?
Quay crane for container terminals: learn how to match outreach, lift height, capacity, automation, and cycle performance to vessel size and throughput goals.
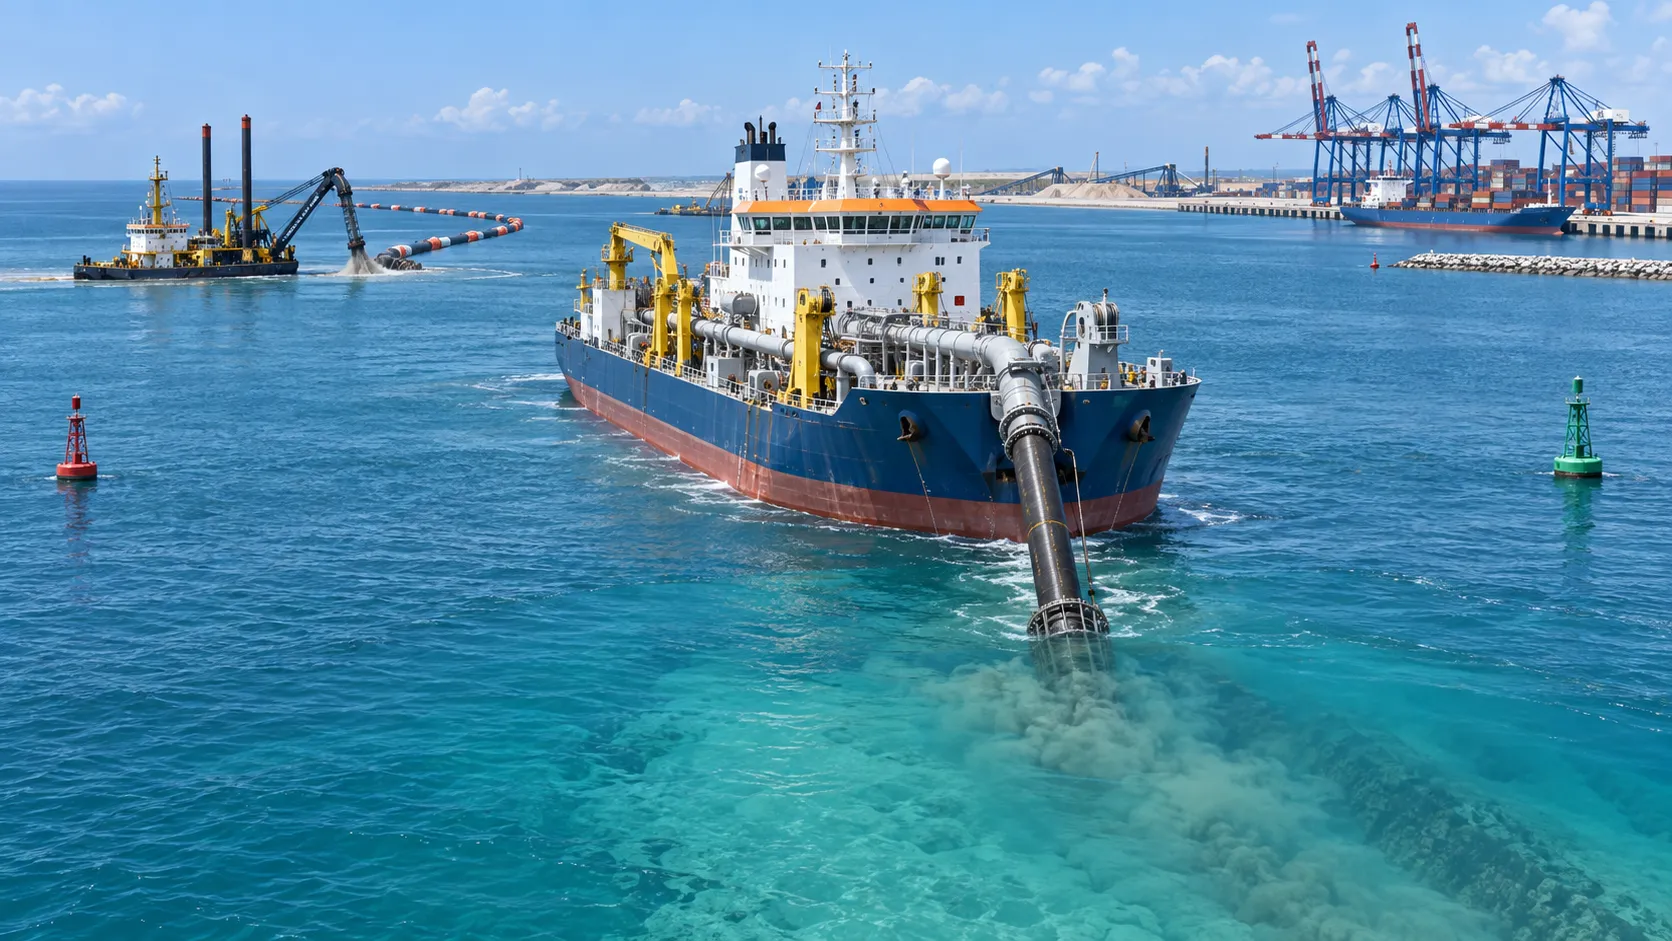
What Dredging Equipment Is Needed for Channel Deepening?
What dredging equipment is needed for channel deepening? Explore dredgers, pipelines, survey tools, and planning strategies for safer, more efficient port access.
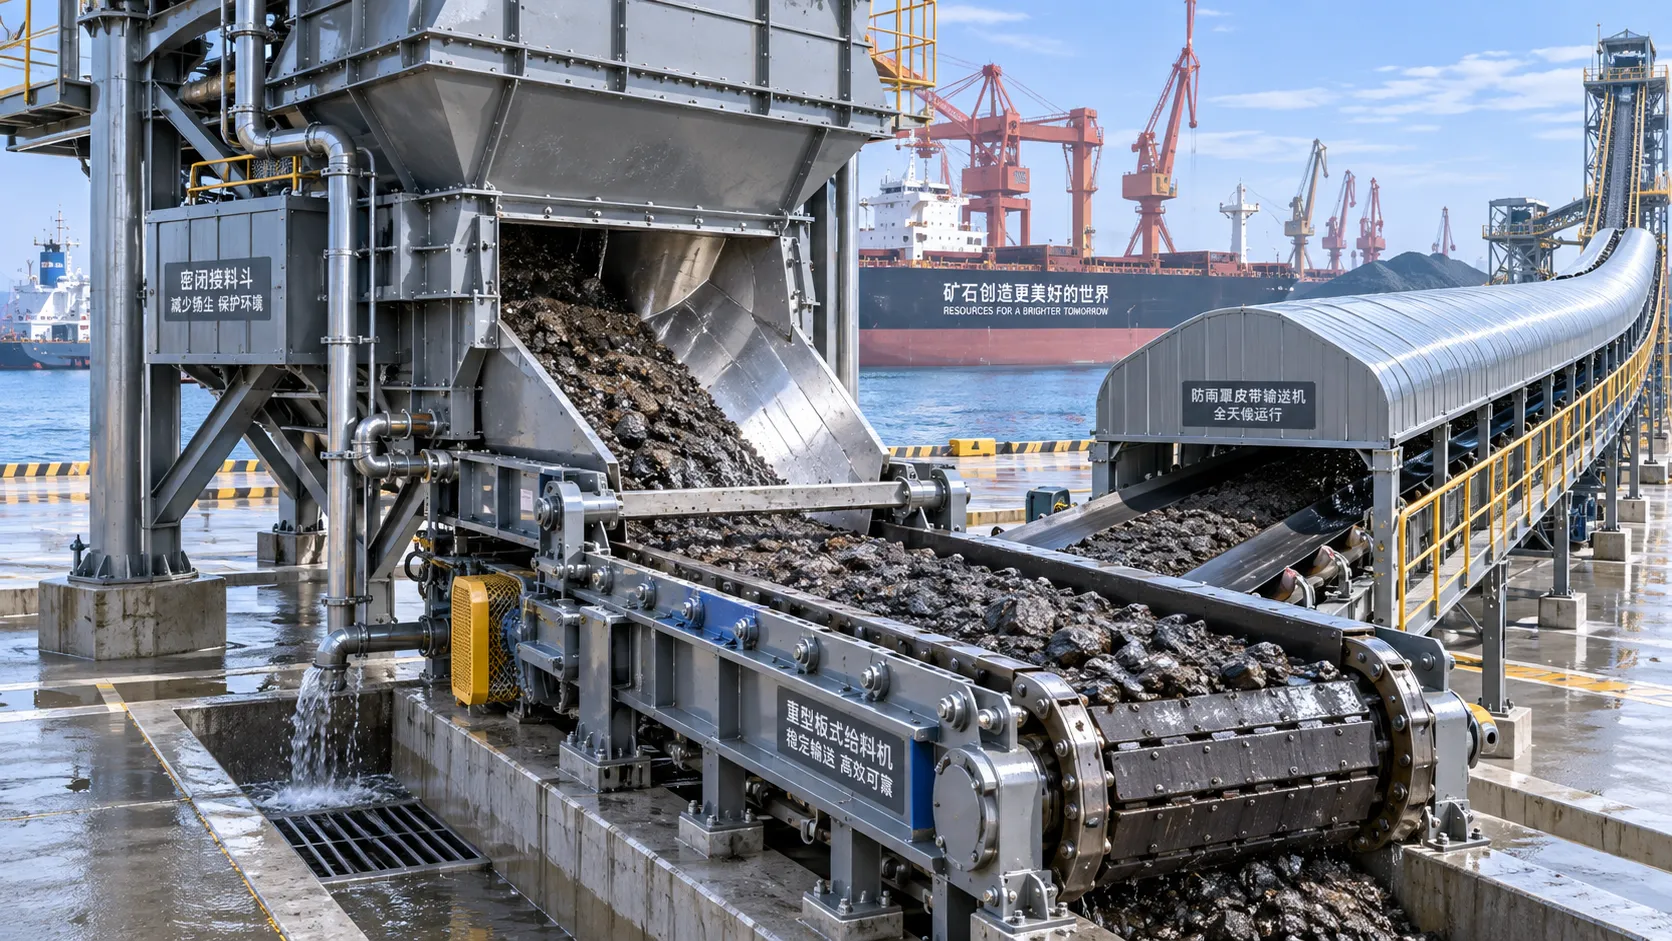
Which Bulk Handling Equipment Suits High-Moisture Cargo?
Which bulk handling equipment suits high-moisture cargo? Compare belt, apron, screw, drag, and slurry systems for reliable flow, less carryback, and higher terminal uptime.
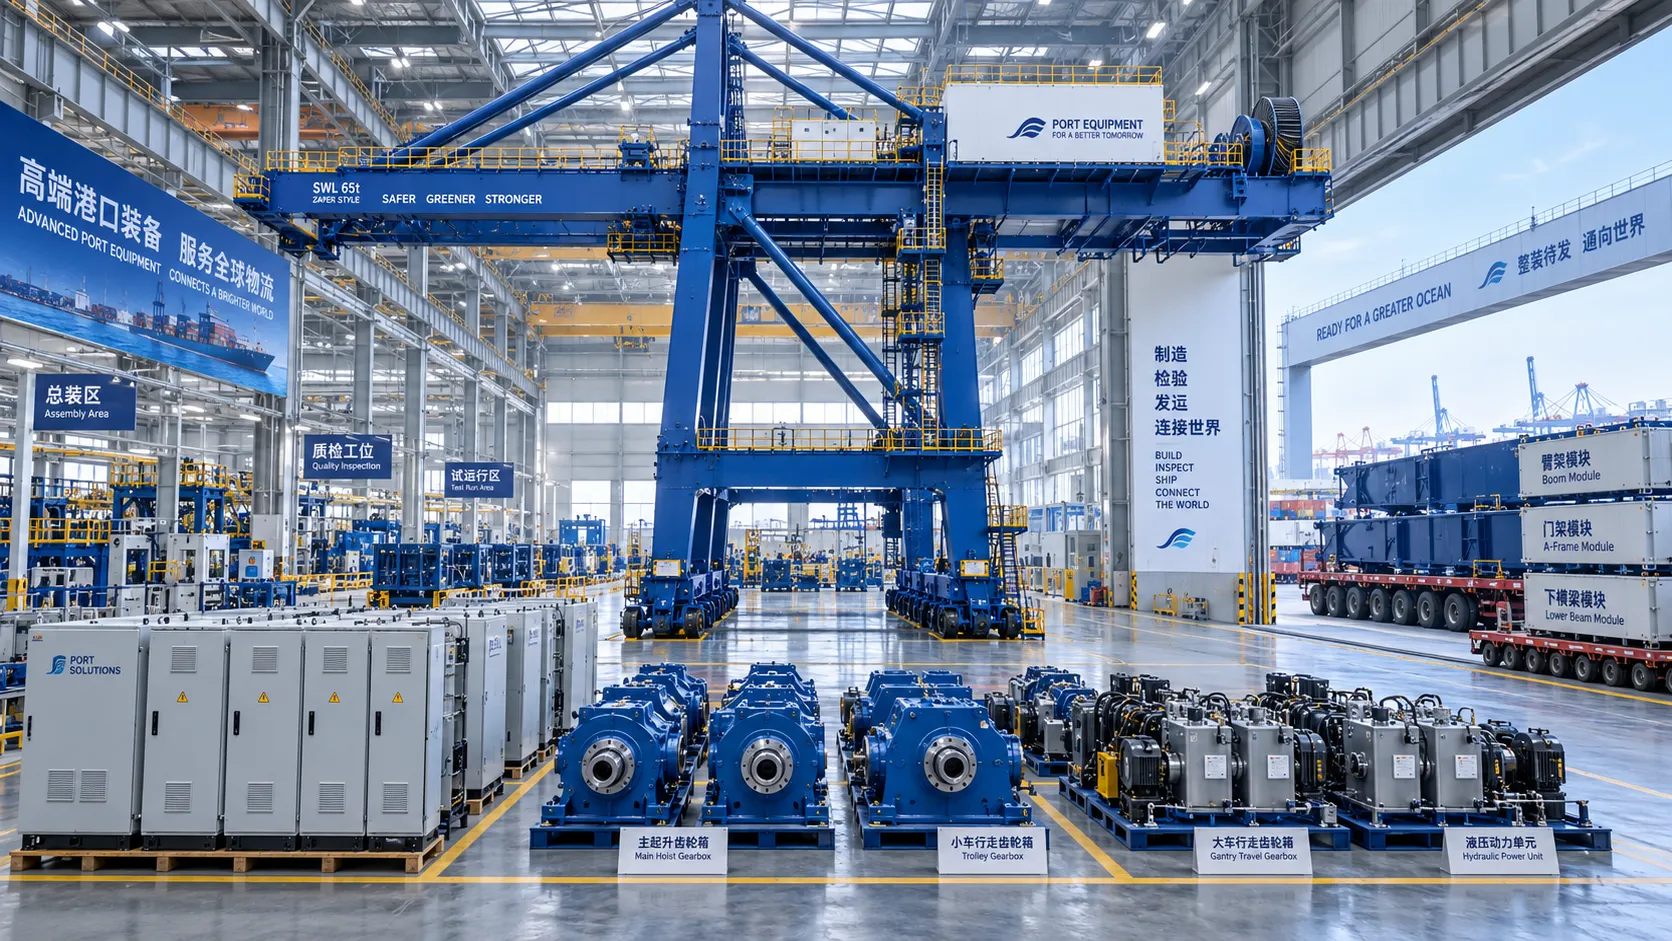
How Can Port Equipment Lead-Time Risk Be Managed?
How can port equipment lead-time risk be managed? Explore practical strategies to control critical paths, suppliers, transport, site readiness, and commissioning delays.
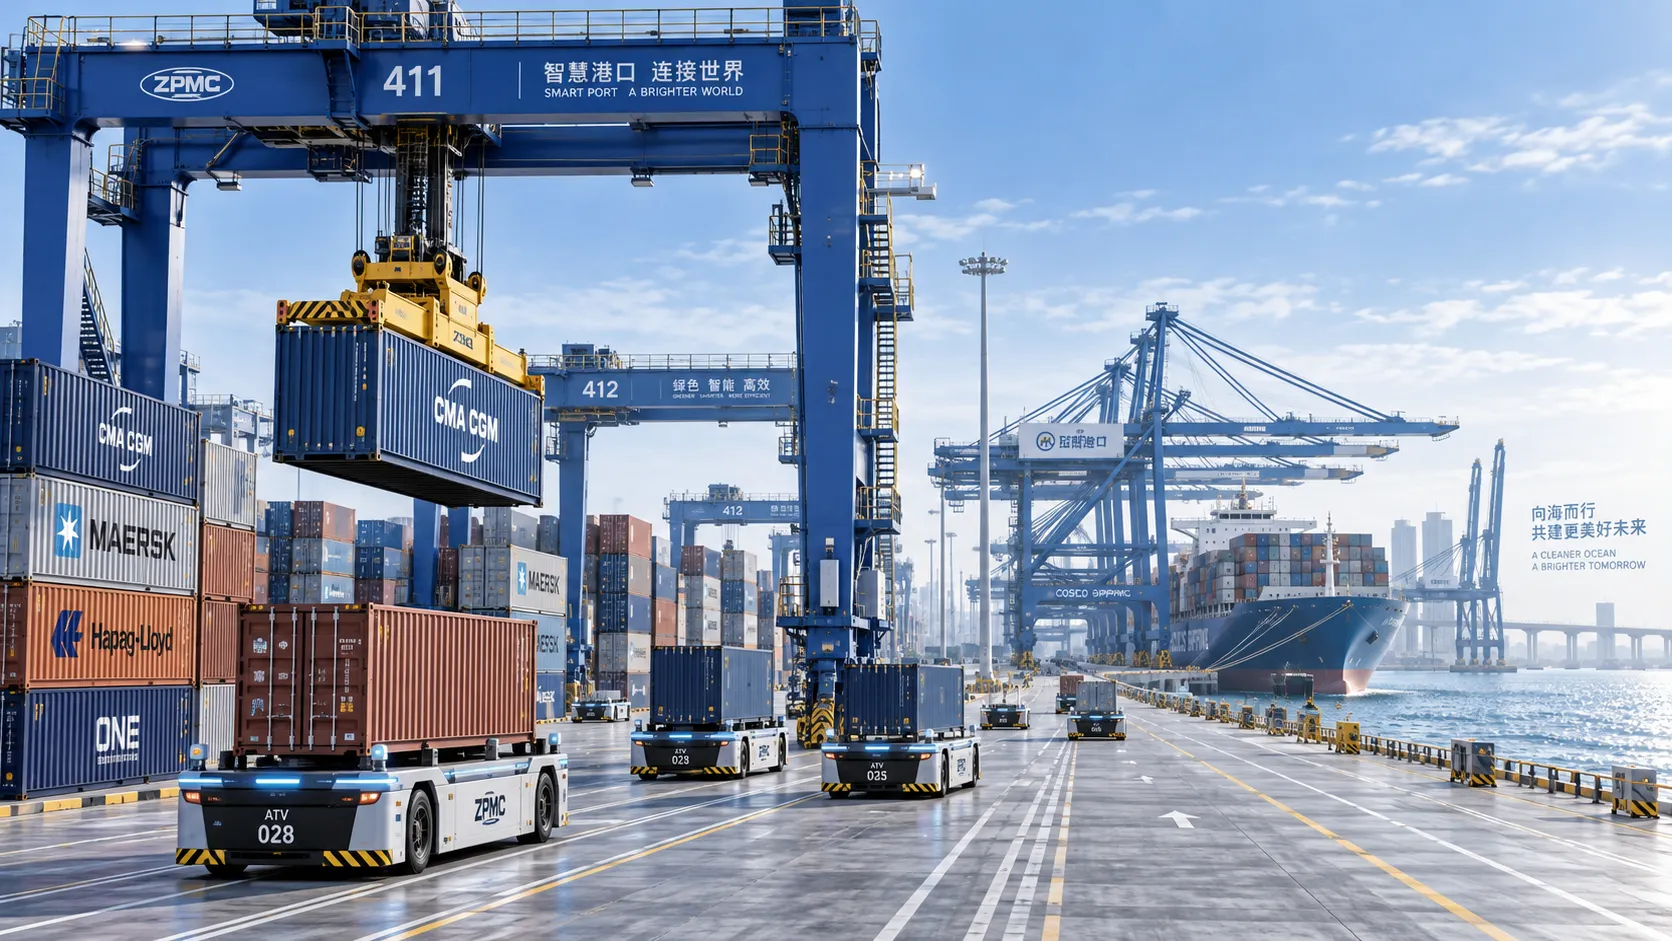
Terminal Automation Technologies That Raise Container Throughput Without Yard Disruption
Terminal automation technology that increases container throughput without disrupting yard flow. Explore smarter integration, resilient workflows, and phased deployment strategies.
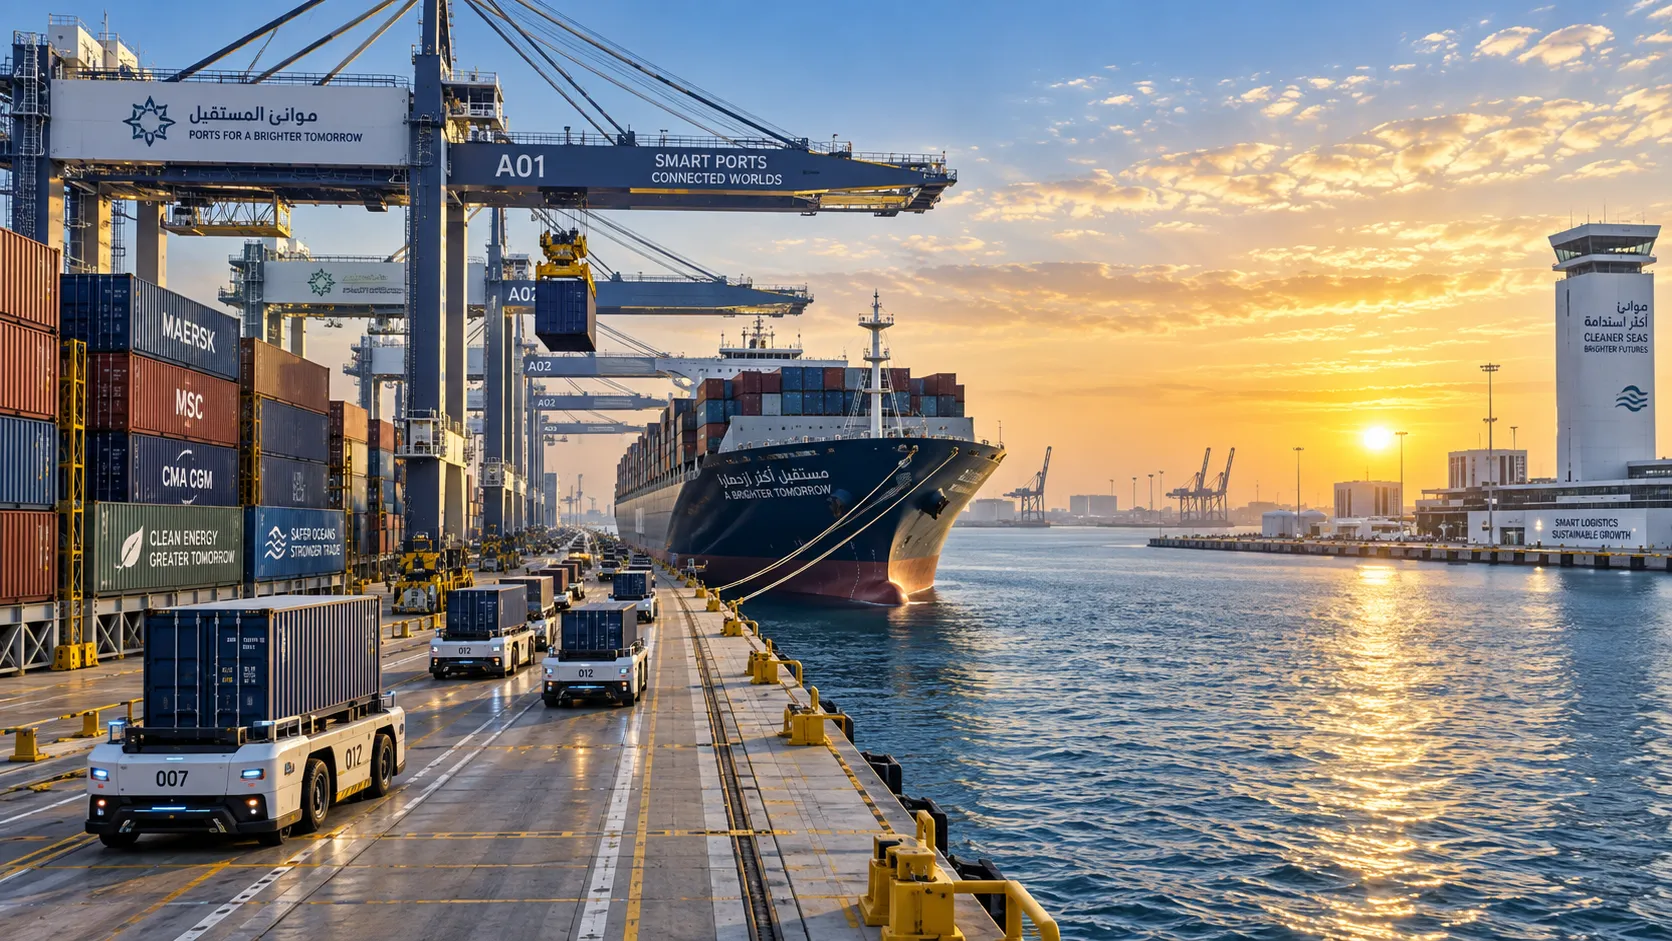
Middle East Port Automation: Key Market Drivers, Projects, and Investment Risks
Port automation systems Middle East: explore market drivers, flagship projects, integration challenges, and investment risks shaping smarter, resilient terminals.
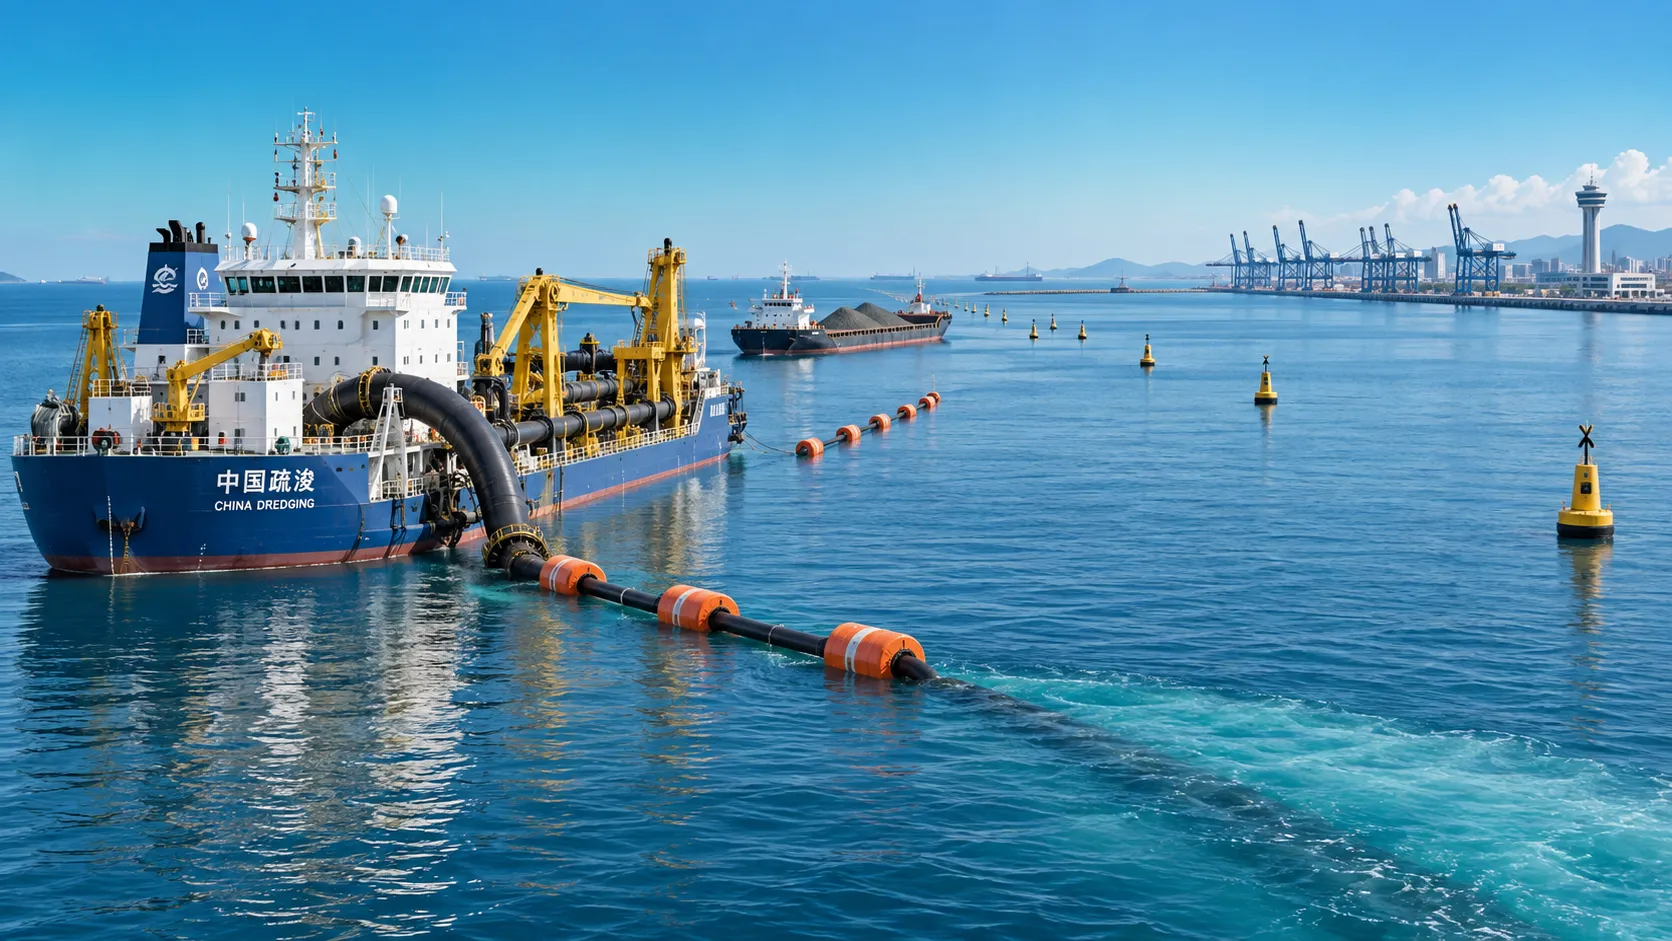
Planning Offshore Dredging Operations: Key Risks, Methods, and Project Controls
Offshore dredging operations demand smart planning. Explore key risks, proven methods, environmental controls, and project strategies for reliable delivery.