
Related News
- 00
0000-00
Marine Engineering Solutions for Dredging in Ports: Key Design Factors - 00
0000-00
What Data Does a Smart Port Control Architecture Need to Operate? - 00
0000-00
CE-Marked Quay Cranes: How to Verify Compliance Documents - 00
0000-00
Port Automation Systems in Latin America: Choosing the Right Solution - 00
0000-00
Scalable Automated Port Systems: Planning for Terminal Capacity Growth
0000-00
Port Equipment Intelligence: How Sensor Data Reveals Early Crane Faults
Early crane faults are rarely identified by a single high reading. A damaged bearing may produce short vibration impulses before its housing becomes noticeably hotter; a deteriorating gearbox may develop load-dependent sidebands while its overall vibration remains unremarkable. The useful warning is a repeatable change under comparable operating conditions—not simply a value above yesterday’s average.
That distinction matters on ship-to-shore cranes, rail-mounted gantry cranes, and rubber-tyred gantry cranes. Acceleration, load pickup, trolley travel, braking, and structural movement all generate legitimate signal changes. Effective port equipment intelligence for engineers must separate these operating effects from deterioration, then connect the evidence to an inspection or maintenance action. A monitoring dashboard alone does not establish that capability.
Crane duty cycles can hide—or imitate—developing faults
A continuously running machine offers relatively stable windows for comparison. A crane does not. Hoist speed changes during each lift, motor torque changes with suspended load, and lowering can place the drive in regenerative operation. Gear backlash and brake transitions produce transients that should not automatically be classified as damage.
Useful monitoring therefore begins with an operating-state model. Vibration, temperature, and electrical measurements need context from the control system: actual speed, direction, load estimate, acceleration state, brake command, and mechanism position. Where available, brake feedback and encoder measurements help distinguish commanded behavior from actual response.
The comparison unit should be a defined operating segment, such as steady-speed loaded hoisting or constant-speed trolley travel. Comparing a loaded acceleration event against an unloaded steady-speed baseline creates an artificial anomaly. Combining both into a daily average can conceal a genuine one.
Even a well-defined segment needs sufficient duration. A low-speed bearing may complete too few revolutions during a short capture to reveal a repeatable defect signature. The acquisition strategy must accommodate the mechanism’s speed and duty cycle rather than impose one recording interval across the entire crane.
What each signal can reveal—and what it cannot
Vibration: preserve the signature, not just the overall level
Overall root-mean-square vibration can indicate broad changes, but it can miss localized bearing damage. A small raceway defect can generate brief impacts whose contribution to total signal energy remains limited. Envelope analysis can expose their repetition by extracting modulation from a suitable high-frequency band.
Interpretation requires bearing geometry and shaft speed. Calculated bearing defect frequencies provide diagnostic references, not exact immutable markers: rolling-element slip and changing contact conditions can shift observed components. A credible diagnosis uses repeatability, harmonics, modulation, and operating context rather than one spectral peak.
For gearboxes, gear-mesh frequency follows tooth count and rotational speed. Changes around mesh harmonics, including sidebands spaced by relevant shaft frequencies, can support investigation of tooth damage or modulation. Such patterns are not uniquely diagnostic; load variation, eccentricity, and transmission characteristics also affect them.
Variable-speed operation makes ordinary frequency spectra difficult to compare. Order tracking relates signal components to shaft rotation, allowing rotation-related features to remain aligned as speed changes. It requires a sufficiently accurate speed reference and appropriate resampling. A commanded speed value may be inadequate during acceleration or speed-tracking disturbances.
Temperature: assess the thermal response to work
A bearing housing that becomes hotter after intensive lifting has not necessarily deteriorated. A more informative measure is its temperature rise relative to ambient conditions and comparable recent duty. Thermal inertia also matters: the temperature measured now reflects earlier loading, not only the current movement.
A developing fault becomes more credible when temperature rises faster, reaches a higher stabilized level, or cools differently under comparable conditions. Housing measurements cannot be assumed to equal internal bearing temperature, and infrared readings require attention to surface emissivity and viewing conditions. Temperature is particularly useful as corroboration, but it should not be expected to detect every early mechanical defect.
Motor current: distinguish mechanical demand from control behavior
Current and estimated torque can reveal increasing resistance or abnormal load modulation. However, current during acceleration includes the torque required to accelerate the mechanism, while hoisting current also reflects suspended load. Raw current trends without those variables can misclassify normal work as deterioration.
Variable-frequency drives add further complexity through switching, control loops, and changing output frequency. Low-rate drive telemetry can support duty-cycle analysis but may not preserve the waveform information needed for electrical signature analysis. Evaluating such a capability requires knowing whether the system acquires raw phase currents, processed drive values, or both.
Sensor installation determines which faults remain visible
An accelerometer should have a mechanically sound transmission path from the component being assessed. A sensor on a flexible cover or distant structural member may emphasize panel resonance and crane movement while attenuating bearing impacts. Placement near bearing supports, with measurement directions selected for the expected forces and fault modes, provides a more defensible starting point.
Mounting method affects usable bandwidth. A rigid installation supports different measurements from a temporary magnetic mount or an inadequately bonded sensor. The specified sensor frequency range is not the same as the usable response of the installed measurement chain. Mounting, cabling, signal conditioning, and acquisition electronics all contribute.
Port conditions introduce additional failure mechanisms for the monitoring system itself. Salt exposure, water ingress, cable movement, electromagnetic interference, and connector degradation can create missing or misleading data. Sensor health checks should identify flatlined channels, clipping, implausible offsets, communication gaps, and changing noise floors before those signals enter a diagnostic model.
Sampling must follow the fault mechanism. High-frequency bearing analysis requires an appropriate sensor bandwidth, acquisition rate, and anti-alias filtering. Slow supervisory-control trends cannot reconstruct discarded vibration detail. Local waveform processing can reduce communications demand, but retaining event waveforms is valuable when an alarm needs independent examination.
A trustworthy baseline is conditional, not permanent
A baseline should represent an assessed reference condition. Data collected immediately after installation may already contain wear, misalignment, or lubrication problems. Maintenance records, commissioning checks, and targeted inspection help establish what “normal” actually means.
Separate baselines may be needed for different speeds, directions, loads, and operating modes. Where enough representative data exist, a model can estimate expected behavior from these variables and trend the residual—the difference between observed and expected response. This can reveal deterioration that a fixed threshold obscures.
Adaptive models introduce another risk: gradual deterioration can be absorbed into an automatically updated definition of normal. Baseline updates therefore need change control. Component replacement, lubricant changes, sensor remounting, and control-system adjustments should be recorded because each can legitimately alter the signal.
Comparisons between nominally identical cranes can support investigation, but they do not remove these requirements. Differences in mounting, gearbox configuration, structural response, and duty can make fleet-wide absolute thresholds misleading.
Turn an anomaly into a defensible maintenance decision
An anomaly identifies a departure from expected behavior; it does not establish the failed component, urgency, or remaining service life. The diagnostic chain should preserve that distinction.
Consider a hypothetical hoist gearbox showing rising bearing-envelope activity during matched steady-speed lifts. Confidence increases if the pattern repeats across several comparable cycles, follows the relevant rotational relationship, and appears on a nearby channel. Supporting temperature changes or lubricant debris findings can strengthen the case. An isolated spike during load pickup provides much weaker evidence.
Alarm validation should test competing explanations: Was the sensor disturbed? Did the drive configuration change? Was the operating segment misclassified? Does the feature persist outside one unusual lift? This prevents a technically impressive signal plot from becoming an unsupported work order.
Escalation should reflect both evidence and consequence. A persistent low-severity change may justify a targeted inspection and increased sampling. Rapid progression, abnormal braking behavior, or evidence affecting load retention requires a different response under the crane’s established safety procedures. Advisory condition monitoring must not silently replace certified protective functions or prescribed inspections.
Remaining-useful-life estimates deserve particular caution. Converting a trend into “hours to failure” requires a validated relationship between the measured feature, damage progression, future loading, and a defined failure criterion. Without that foundation, a documented condition category and inspection recommendation are more defensible than a precise countdown.
Use standards to define the process, not invent a universal limit
ISO 17359 provides general guidance for establishing a machine condition-monitoring program. Its relevance lies in linking equipment assessment, monitoring methods, and diagnostic activity. The ISO 13374 series addresses condition-monitoring data processing, communication, and presentation, providing a useful reference when evaluating how measurements become actionable information.
The ISO 20816 series addresses measurement and evaluation of machine vibration within the scope of its individual parts. It should not be treated as a universal crane alarm table. Applicability depends on the machine, measurement location, operating conditions, and relevant part; transient crane duty and localized bearing diagnostics require additional consideration.
Crane inspection requirements remain a separate obligation. The ISO 9927 series concerns crane inspections, while applicable national rules, manufacturer instructions, and equipment-specific requirements determine the actual inspection regime. A condition-monitoring installation does not by itself demonstrate compliance or justify longer inspection intervals.
Require evidence at the system boundary
A technically meaningful evaluation should trace one credible fault mode from sensor to action. For a hoist bearing, that means identifying the measurement location, available bandwidth, operating-state filters, diagnostic feature, alarm logic, and confirmatory inspection. For a drive problem, it means establishing which electrical and control signals are actually available and at what resolution.
Acceptance testing should examine missed events, nuisance alarms, data loss, and timestamp alignment—not just successful dashboard updates. Where verified fault records are available, testing should separate model-development data from evaluation data and preserve realistic operating variation. Simulated signals can test processing logic, but they cannot alone establish field detection performance.
The strongest monitoring capability is therefore not the one reporting the most parameters. It is the one that can explain why a signal changed, show the evidence under comparable crane duty, state the limits of the diagnosis, and support a proportionate maintenance decision before functional failure occurs.
Related News
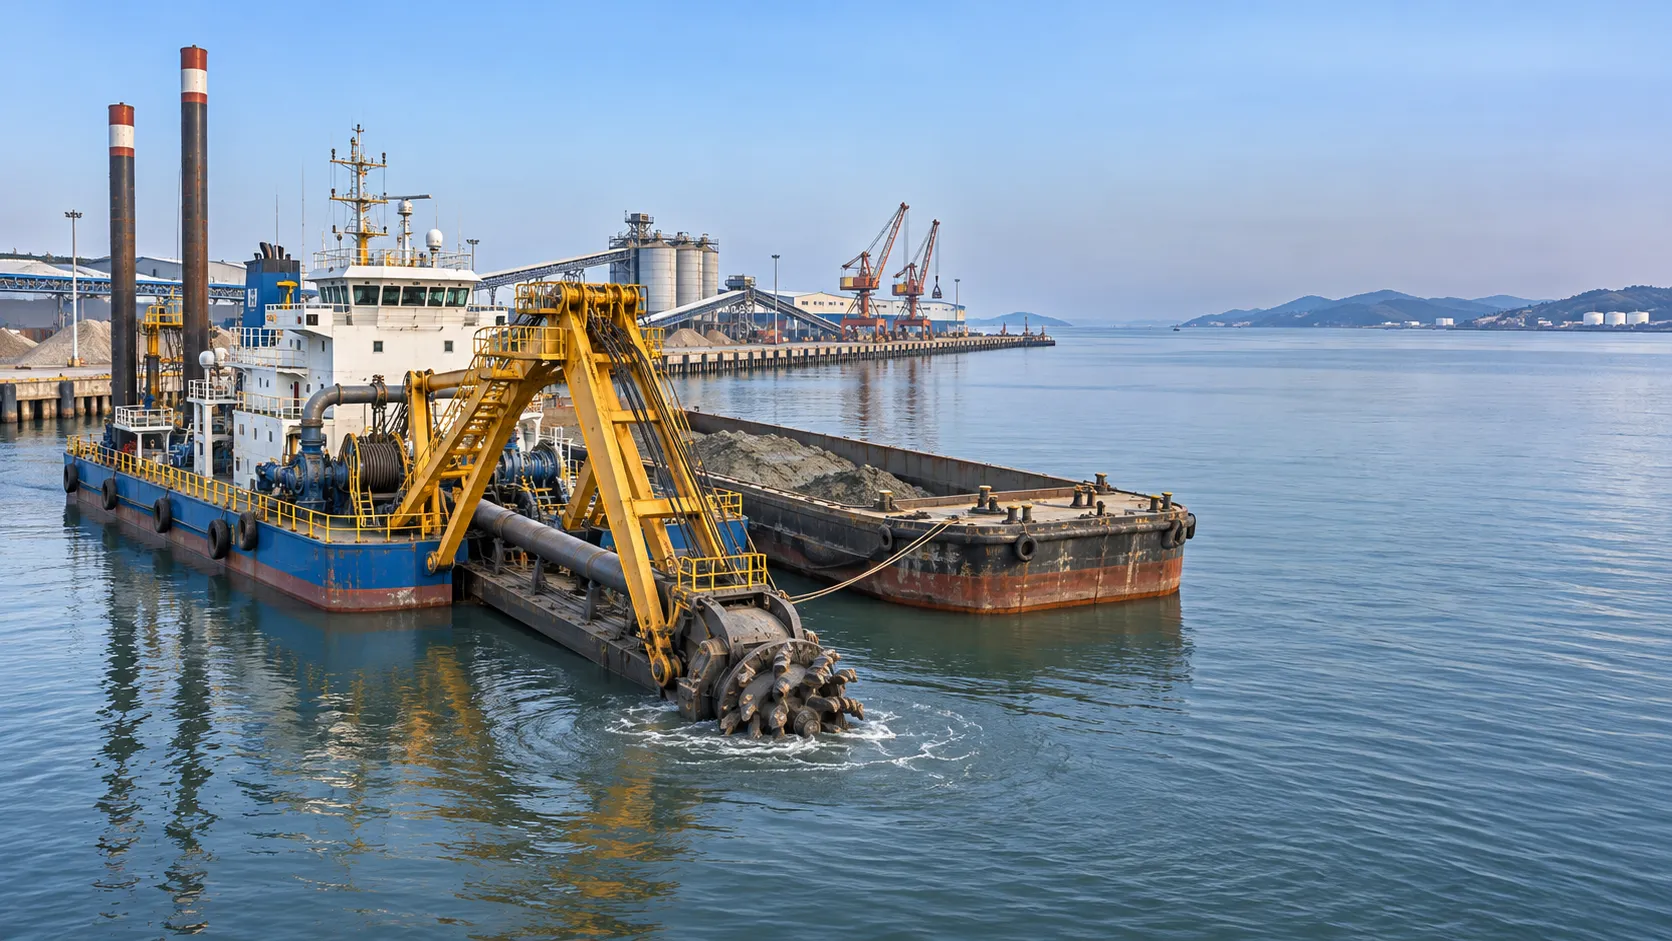
Marine Engineering Solutions for Dredging in Ports: Key Design Factors
Explore marine engineering solutions for dredging ports, from equipment selection and sediment management to safe navigation and survey verification.
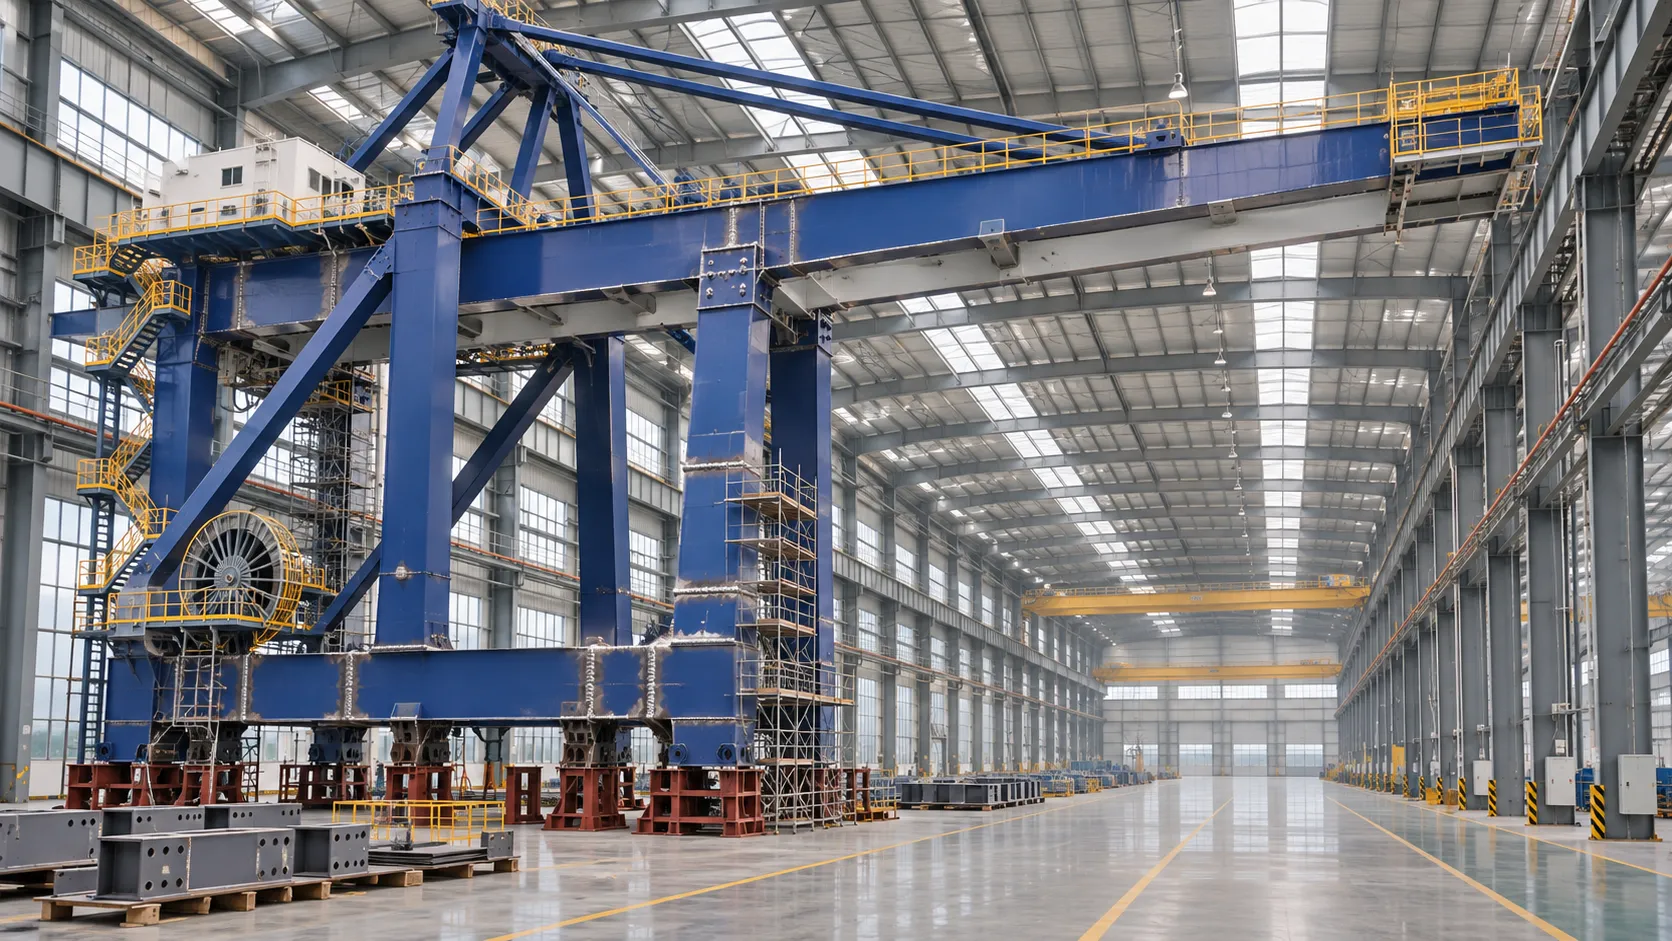
How to Evaluate a Quay Crane Factory: Capacity, Quality and Delivery
Evaluate a quay crane factory with confidence. Learn how to verify production capacity, quality controls, delivery plans, and lifecycle costs before you commit.

What Data Does a Smart Port Control Architecture Need to Operate?
What data is needed for a smart port control architecture? Discover the essential operational feeds, integration requirements and safety checks.
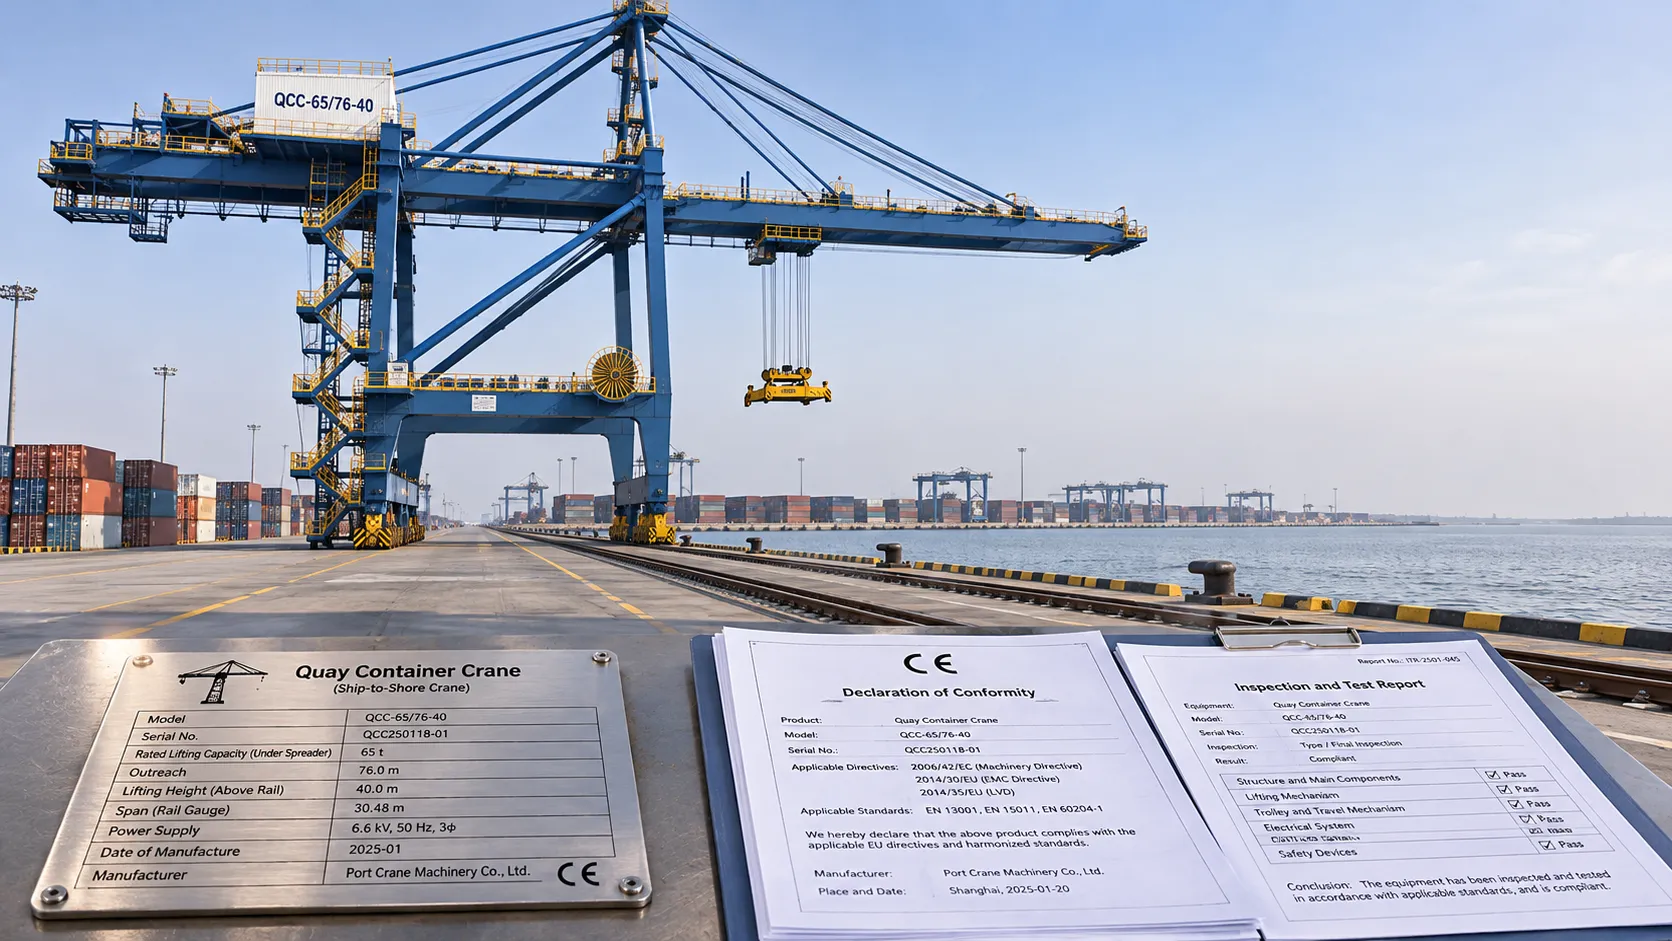
CE-Marked Quay Cranes: How to Verify Compliance Documents
Quay crane CE certified? Learn how to verify declarations, risk assessments and test records for the complete machine before acceptance.
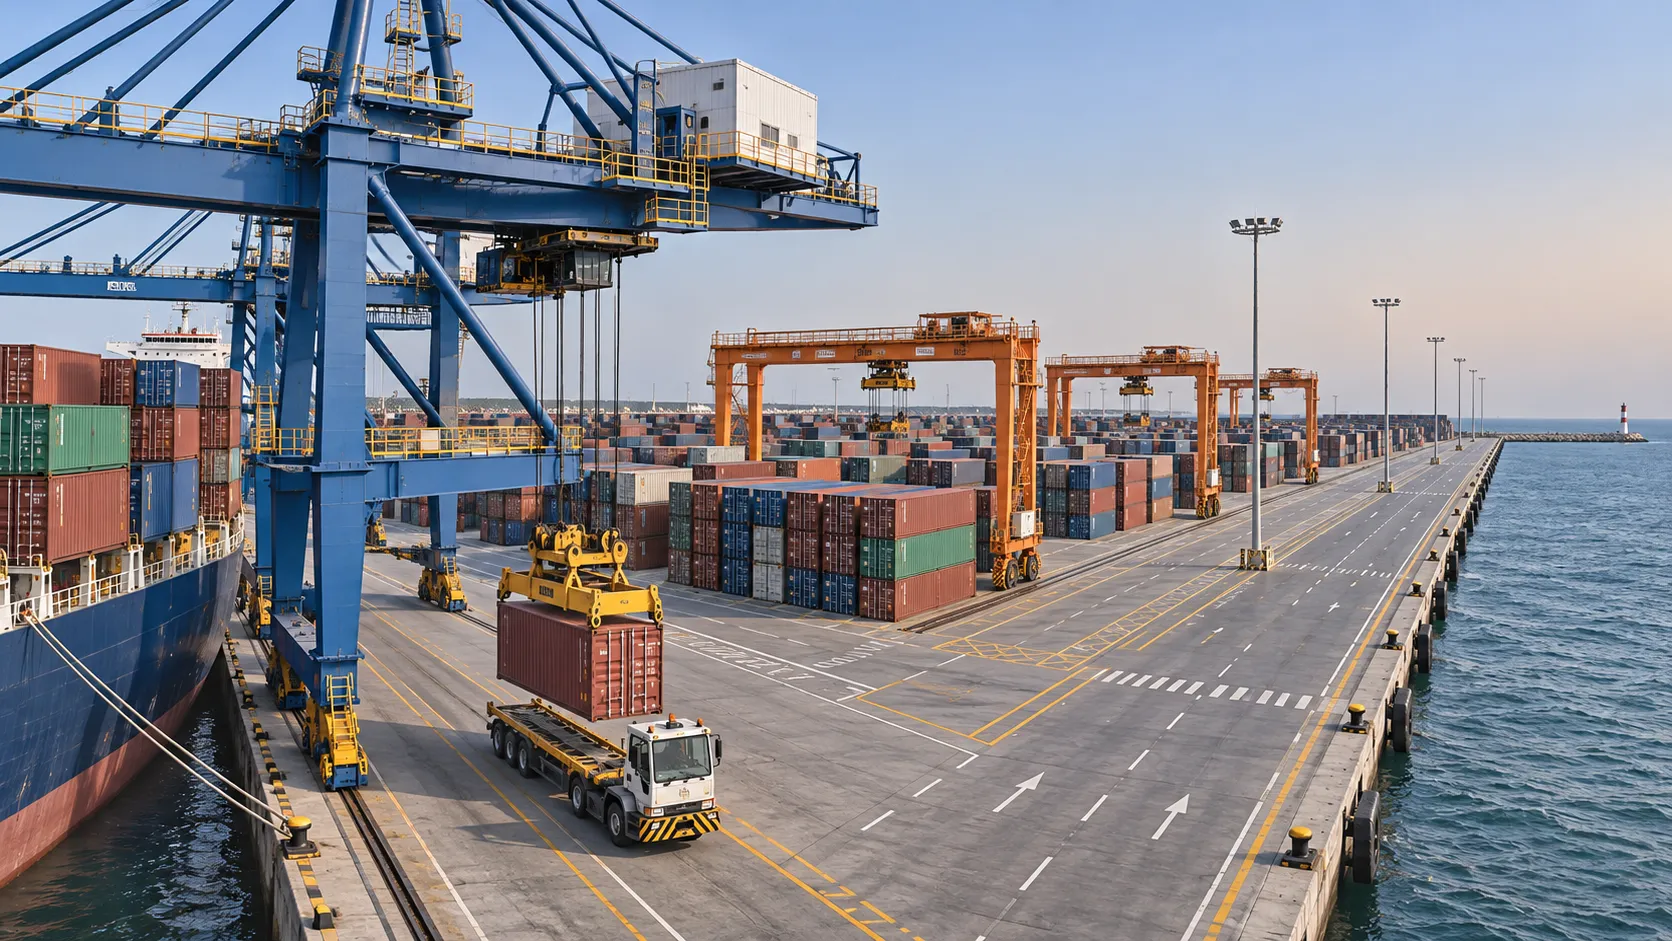
Port Automation Systems in Latin America: Choosing the Right Solution
Explore port automation systems Latin America terminals can use to reduce congestion, assess integration risks, and choose the right solution with confidence.

Scalable Automated Port Systems: Planning for Terminal Capacity Growth
Discover how scalable automated port systems support phased terminal growth, reduce bottlenecks and guide smarter capacity investments.

Europe's Coastal Economies: Key Industries, Jobs and Climate Risks
Explore coastal economics in Europe: discover key industries and jobs, the climate risks they face, and how coastal communities can adapt.

Bulk Cargo Handling Equipment for Ports: Choosing by Cargo and Capacity
Choose bulk cargo handling equipment for ports with confidence. Compare cargo types, realistic throughput, equipment options, and lifecycle costs.

What Affects Container Terminal Efficiency in Southeast Asia?
Discover what affects terminal efficiency in Southeast Asia, from berth planning and yard congestion to inland access, and learn how to assess performance.